— INDUSTRY
Business Services
— TYPE
User Research,
Rapid prototyping
— ROLE
UX Researcher & Strategist
— DURATION & YEAR
8 weeks, 2024
— TEAM
UI/Visual Designers
Business Analysts
Product Owners
Dev Team
THE CHALLENGE:
Team Leads and Agents lack a unified view across operations delivery, requiring them to use multiple tools to manage tasks and track progress.
This fragmented workflow complicates their day-to-day activities and fails to deliver the necessary insights for effective delivery management.
The Operations Delivery Team uses multiple tools for delivery management, such as IWGPH for Agent Productivity, SQF for Quality Measurement, ACF for Risk and controls measure, Onecube & Jira for Work Scheduling.
POTENTIAL BUSINESS IMPLICATIONS:
1. Inefficiencies and higher operational costs due to fragmented workflows and data silos, making it hard to gain a comprehensive view of operations.
2. Reduced productivity and delayed project delivery from excessive time switching between tools, increasing employee burnout risk.
3. Increased stress and lower job satisfaction from updating multiple tools, leading to higher turnover rates and decreased morale.
4. Missed deadlines and potential client dissatisfaction due to delays, risking financial penalties and loss of future business.
PROPOSED SOLUTION:
Through research, we identified the need for a One-Stop Application that provides a comprehensive overview of tasks and progress in a single location.
CLIENTS



UI/UX
Workflow
Summary
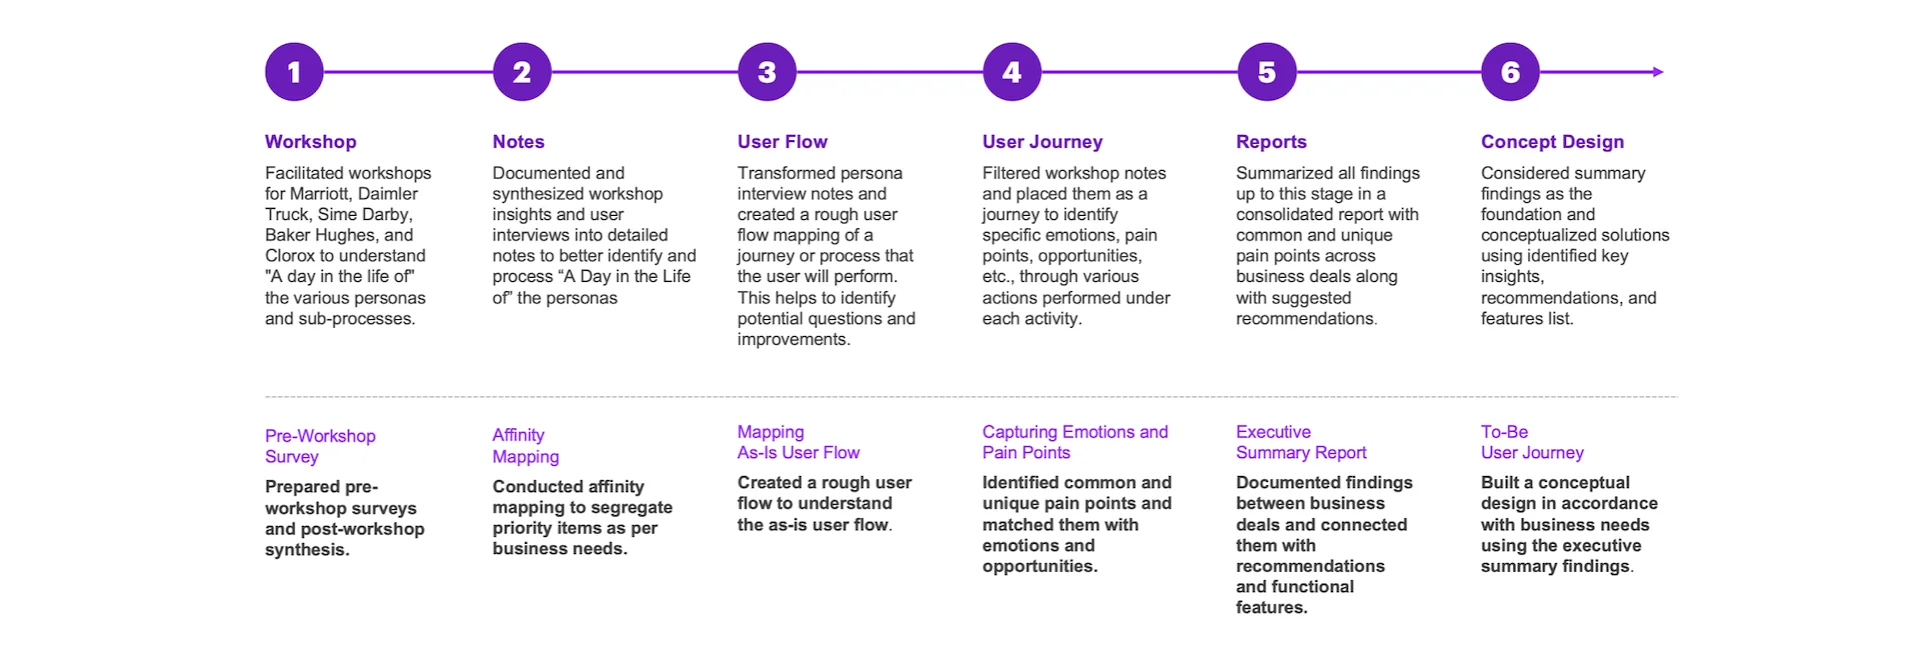
After gathering our initial requirements, we chose to apply a comprehensive set of research methodologies – both Qualitative and Quantitative before moving into concept development.
Since we were building the tool from the ground up, while consolidating key features and information from multiple existing tools, it was critical to ensure we had accurate, well-rounded data. Given the tight timelines, this approach helped us make informed decisions and avoid rework during the design phase
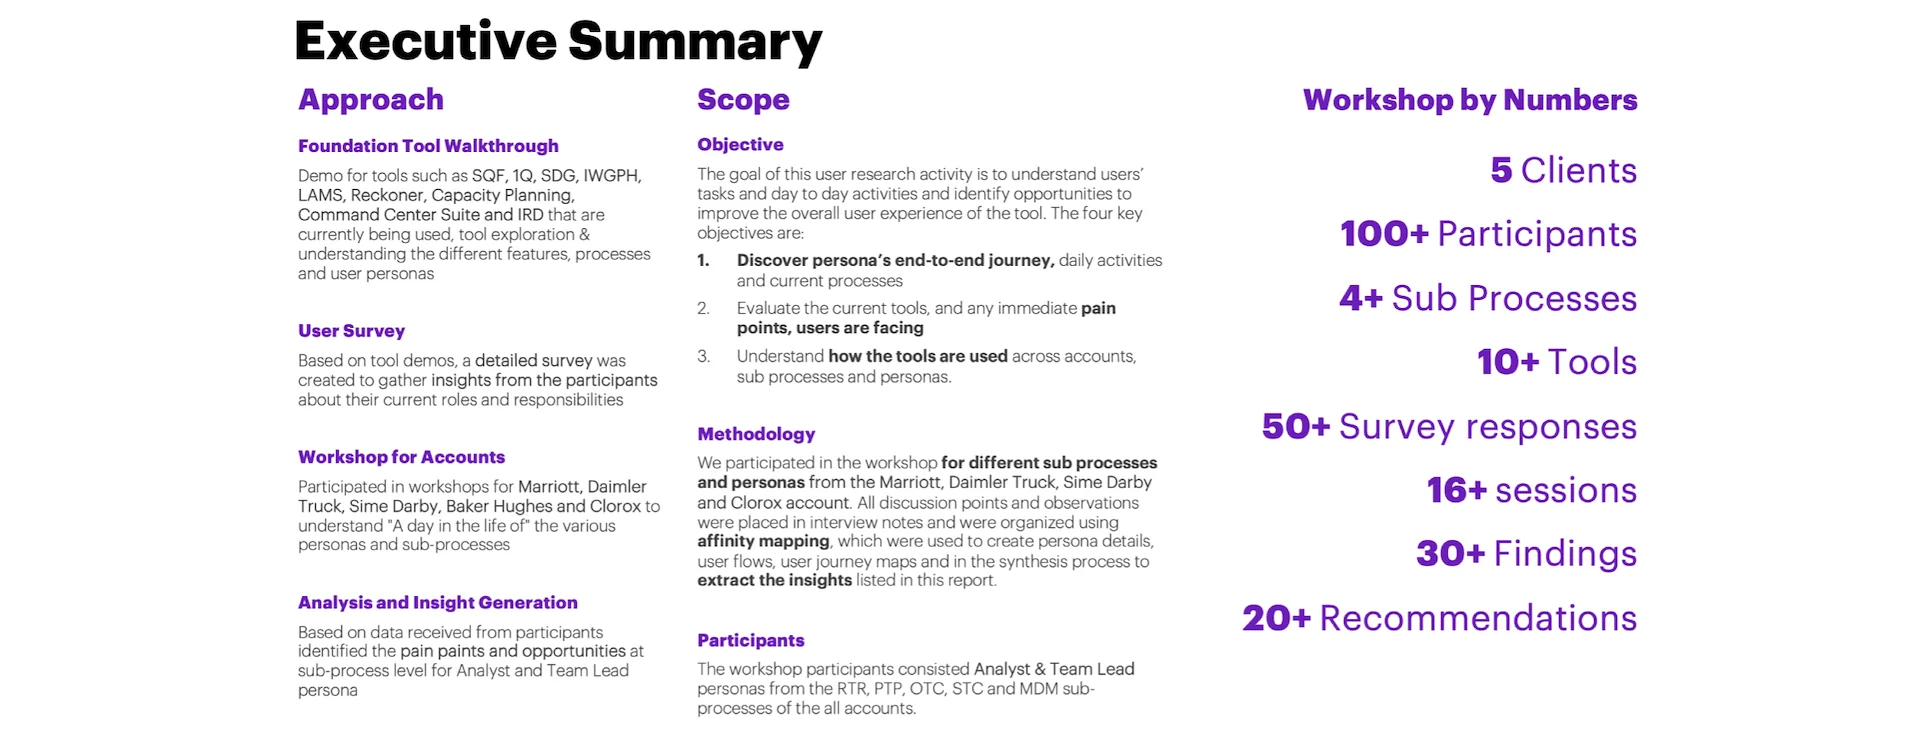
WORKSHOP BY NUMBERS

Method 1:
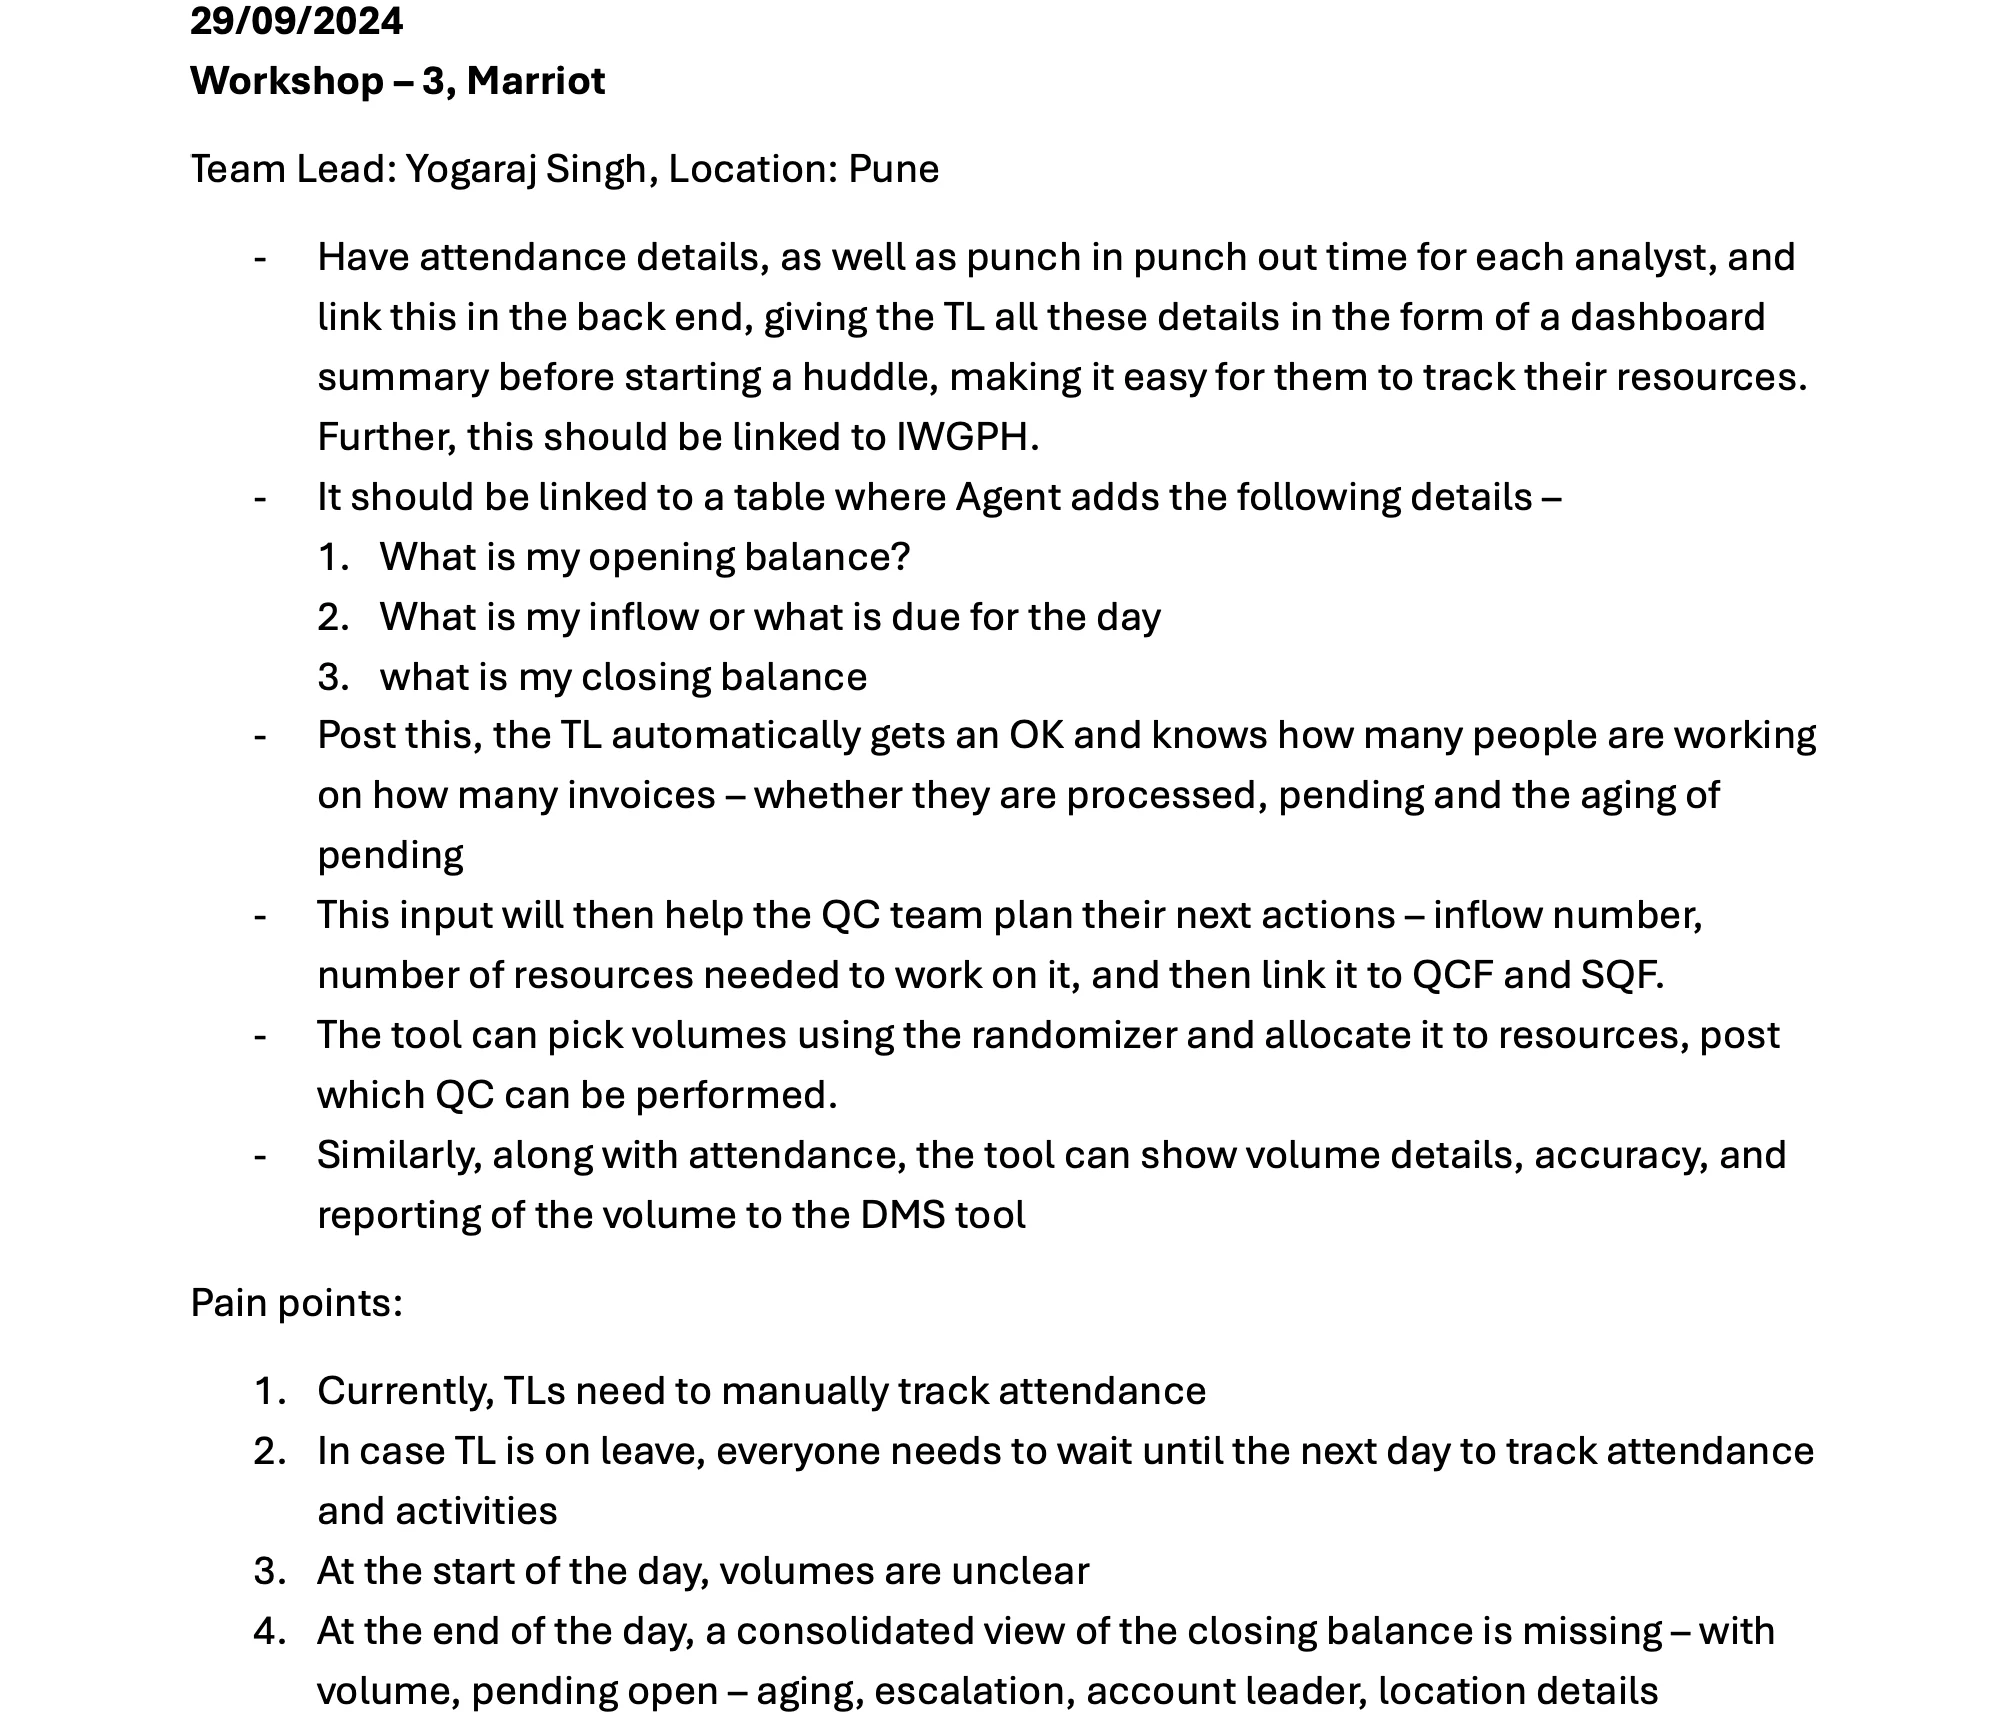
SME Workshop and User Interviews
Following a comprehensive walkthrough of the various existing tools that could contribute to building the one-stop solution, we began drafting targeted questions and themes for our workshops, surveys, and user interviews.
To ensure we had relevant context ahead of the interviews, we distributed online surveys to the selected participants in advance. These surveys captured key details such as their roles, departments, and shift schedules, enabling us to schedule the interviews more effectively and with minimal disruption to their routines.
In parallel, we conducted regular workshops with SDLs, SMEs, and other leadership stakeholders to gain a deeper understanding of their strategic vision and the challenges they faced with the current tooling landscape.
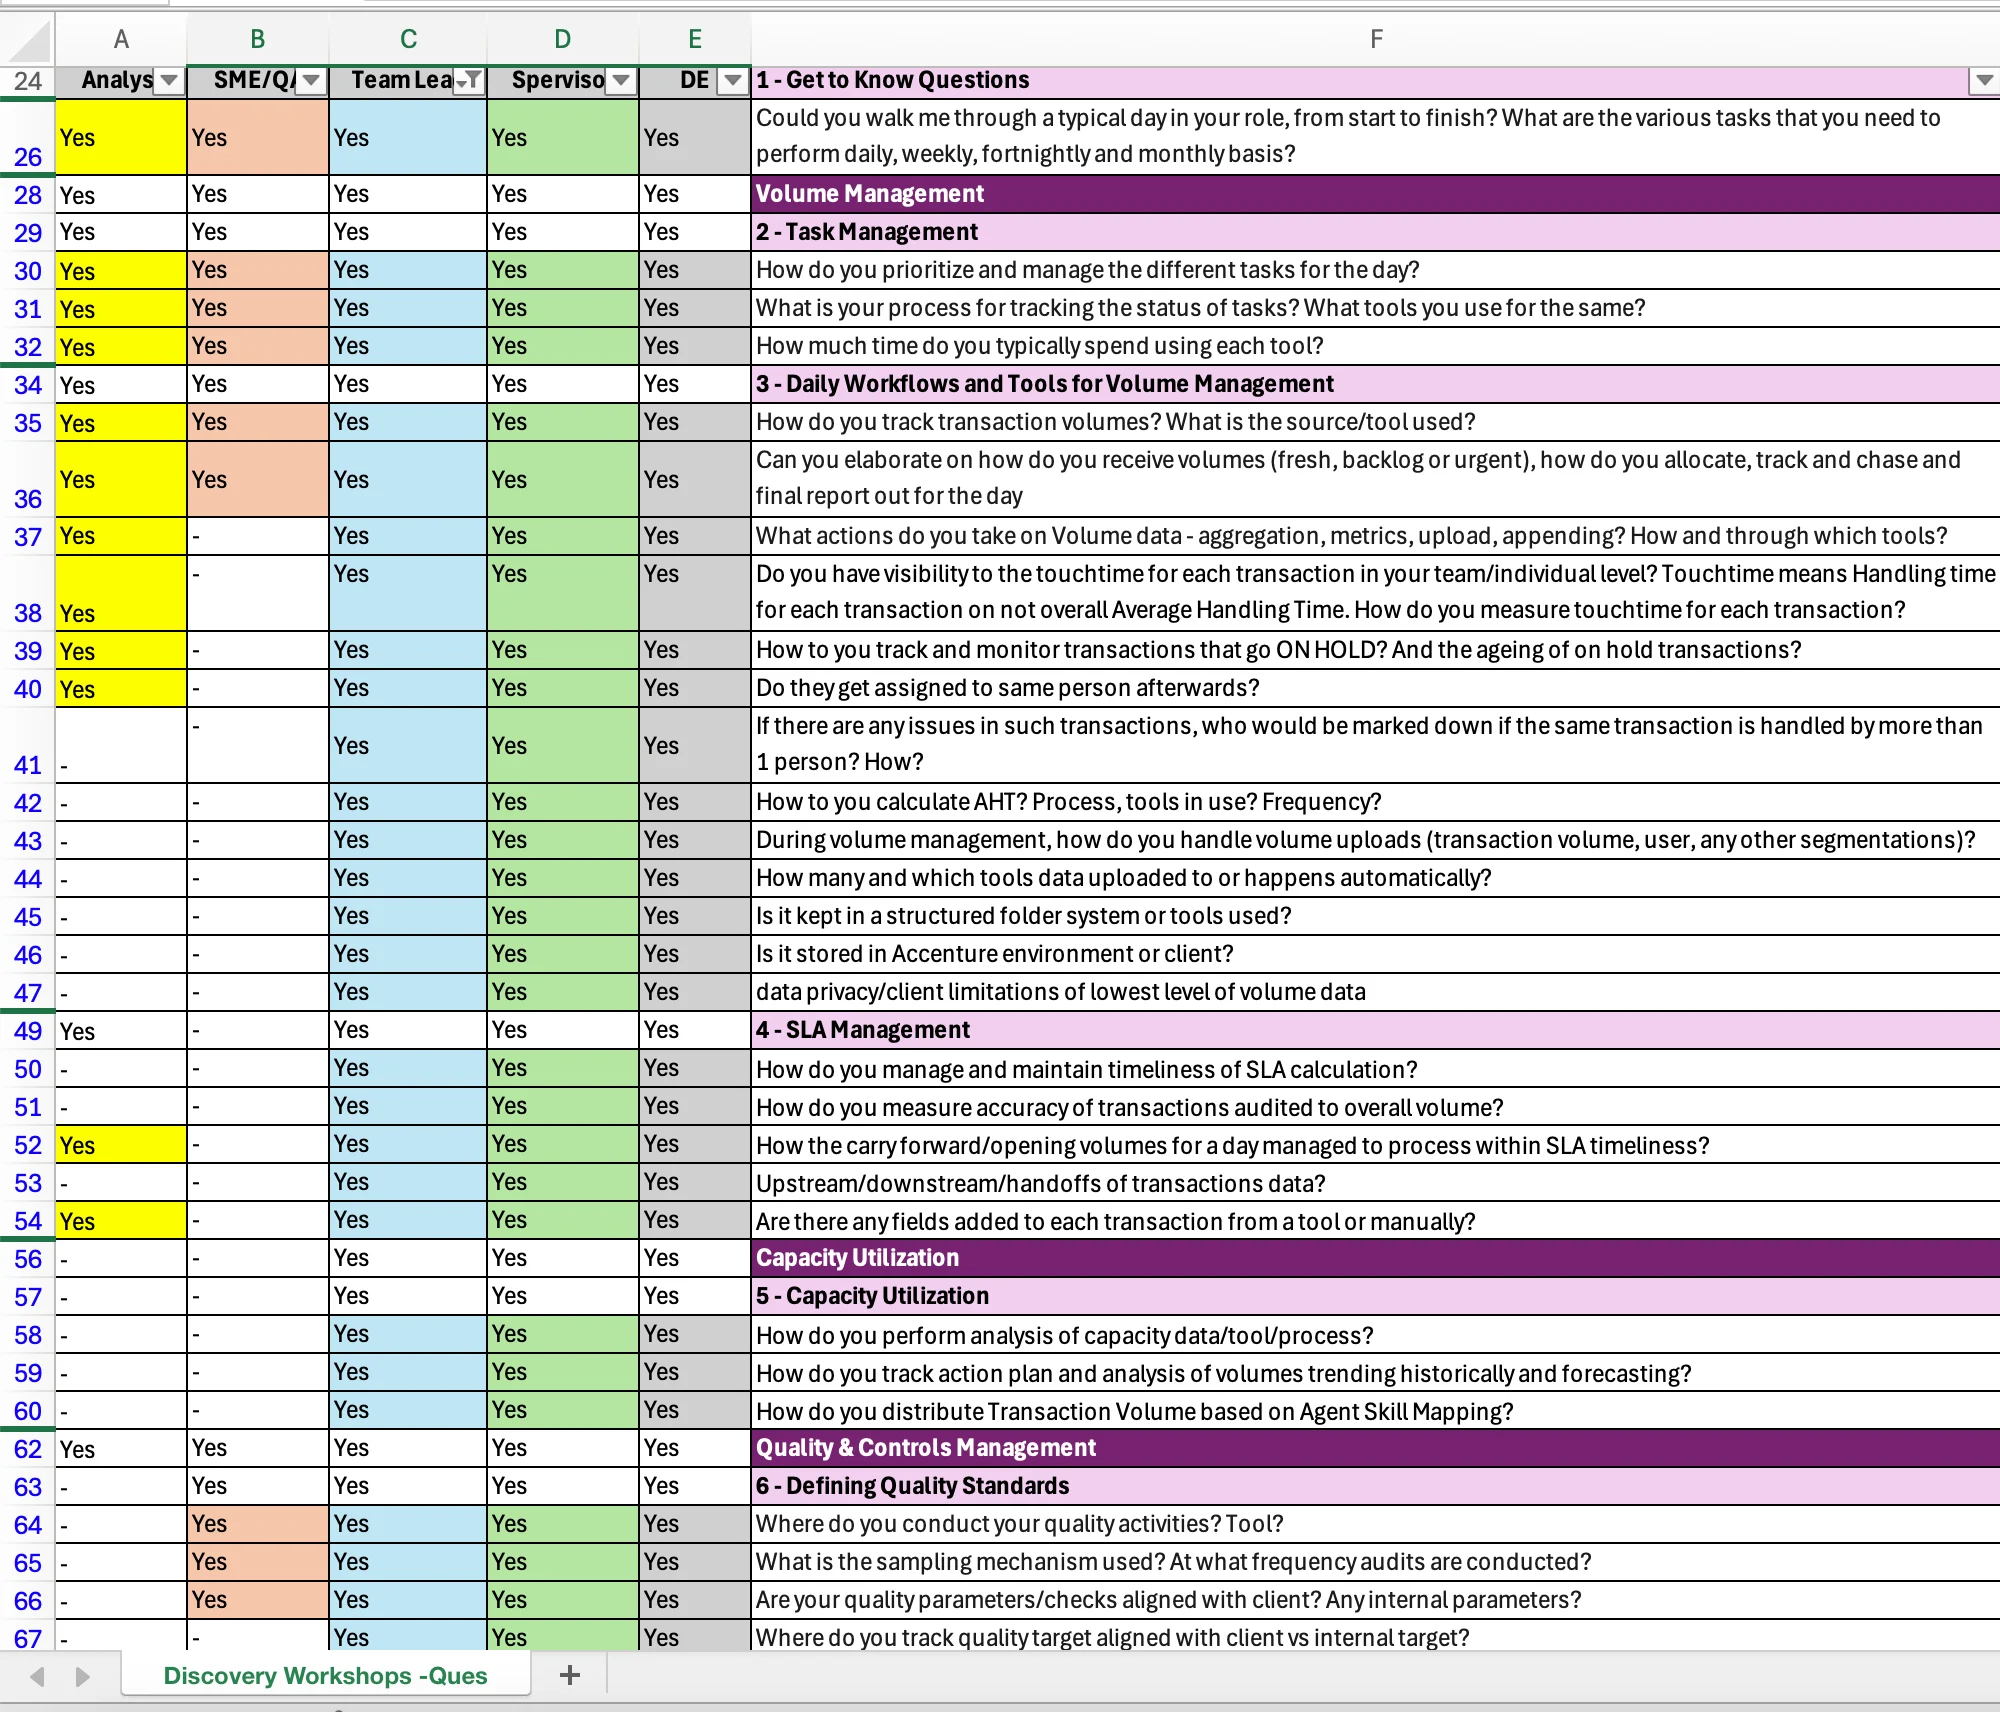
Questionnaire
The questions were carefully curated and organized into distinct categories such as “Getting to Know You,” Task Management, Daily Workflow & Tools, SLA Management, among others. Additionally, each question was mapped to the relevant user personas to ensure contextual relevance during the interviews and workshops.
The Maze tool was used to send out these surveys and track responses.
Detailed Notes
For each user interview, comprehensive notes were captured through a combination of manual documentation and AI-assisted tools such as Copilot.
Method 2:
Affinity Mapping
The interview notes were utilized to conduct Affinity Mapping, enabling the identification and organization of key themes and pain points. This process helped prioritize items based on business needs and strategic relevance.
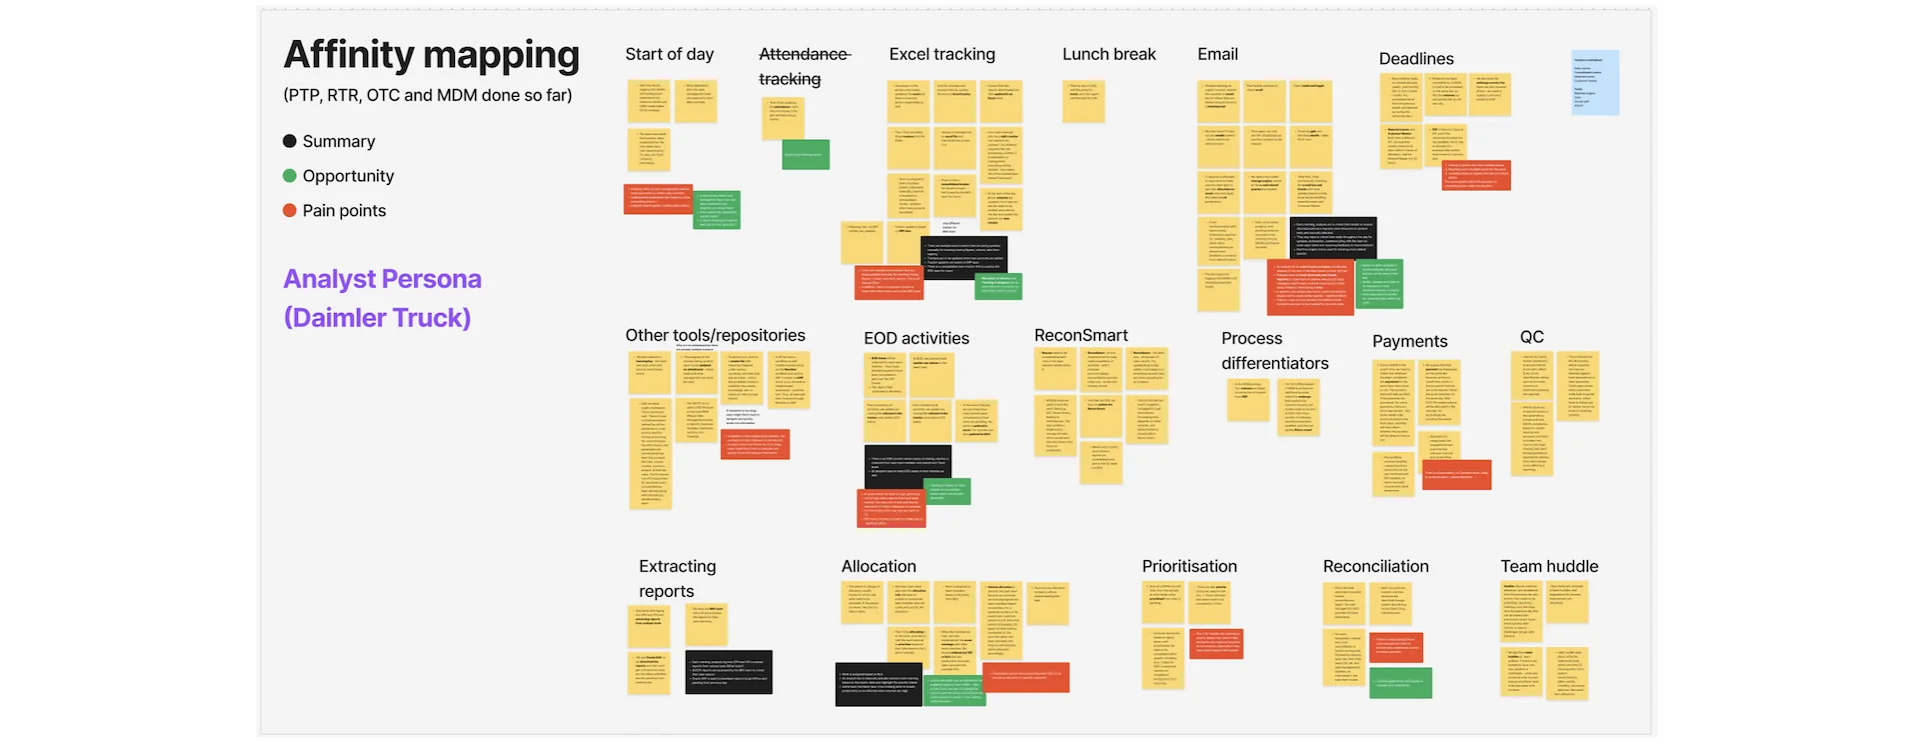
The above Affinity Map is for the Daimler Truck account, Team Lead persona, for all the 4 sub-processes
Method 3:
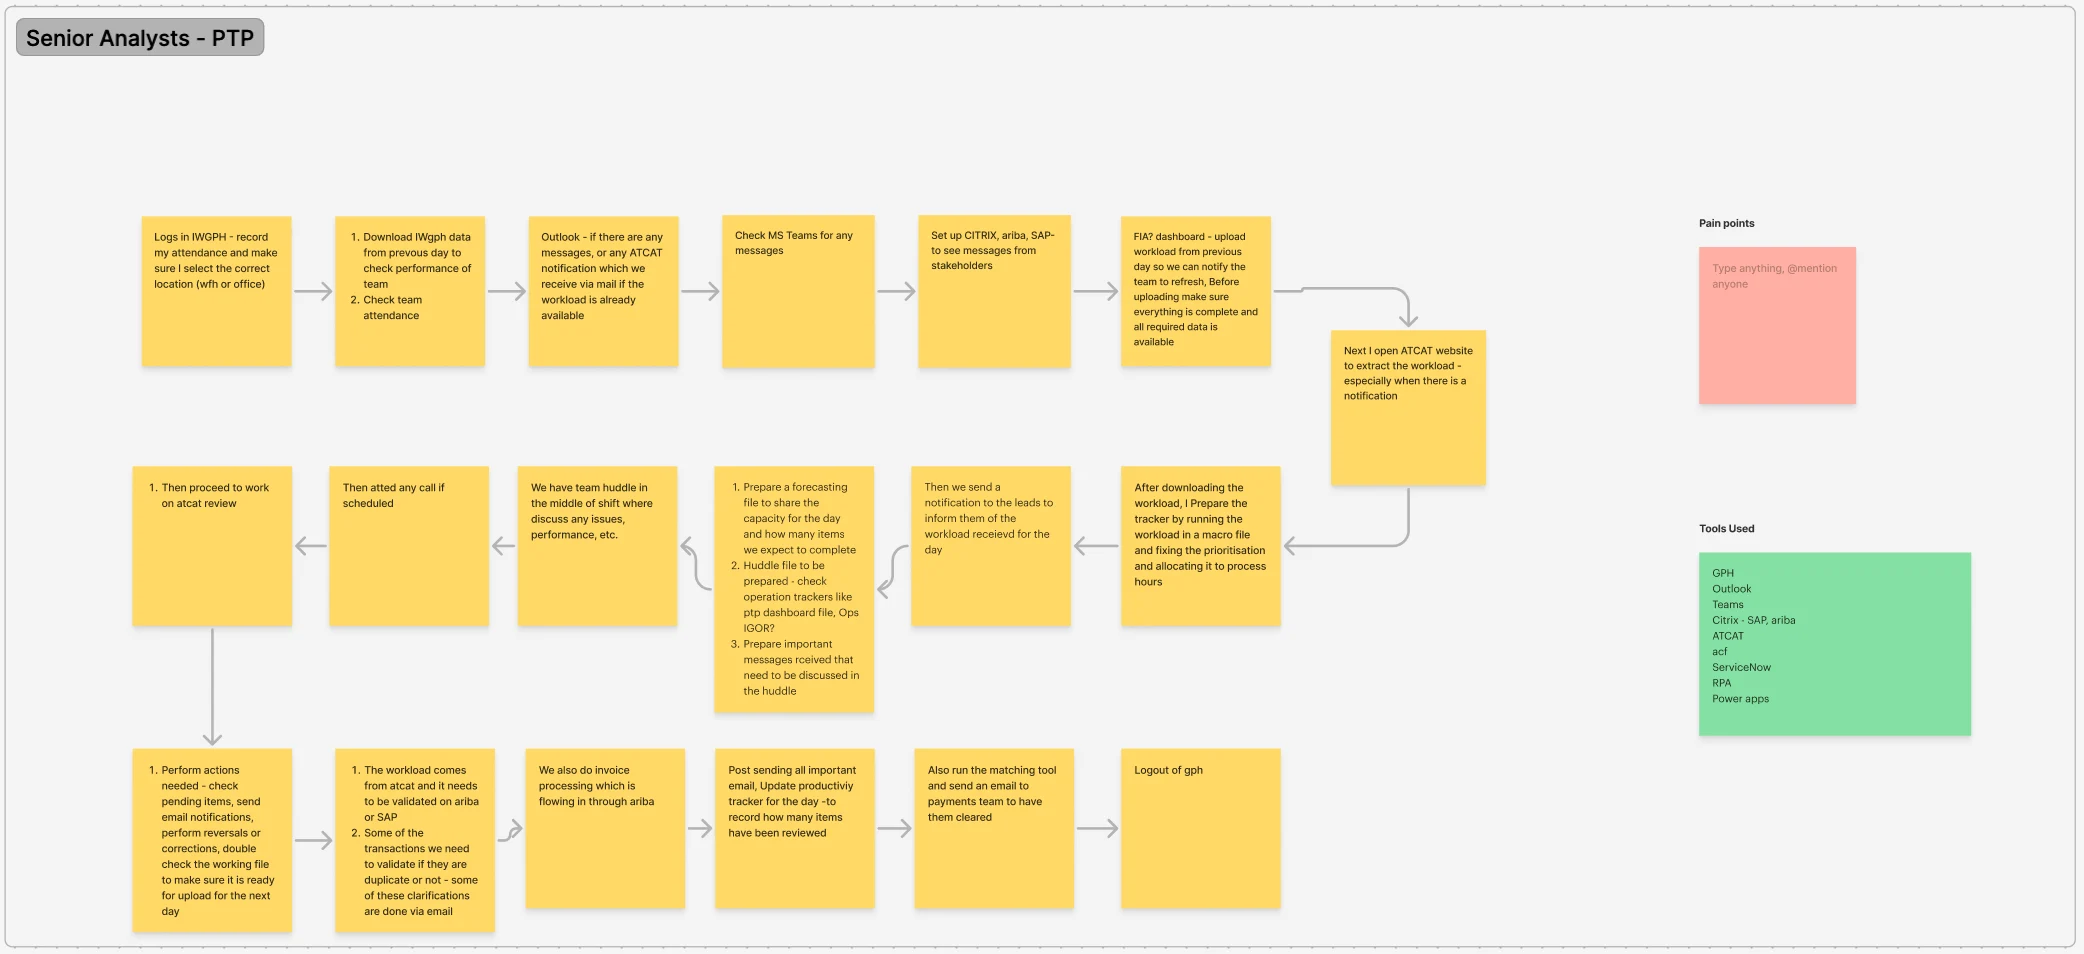
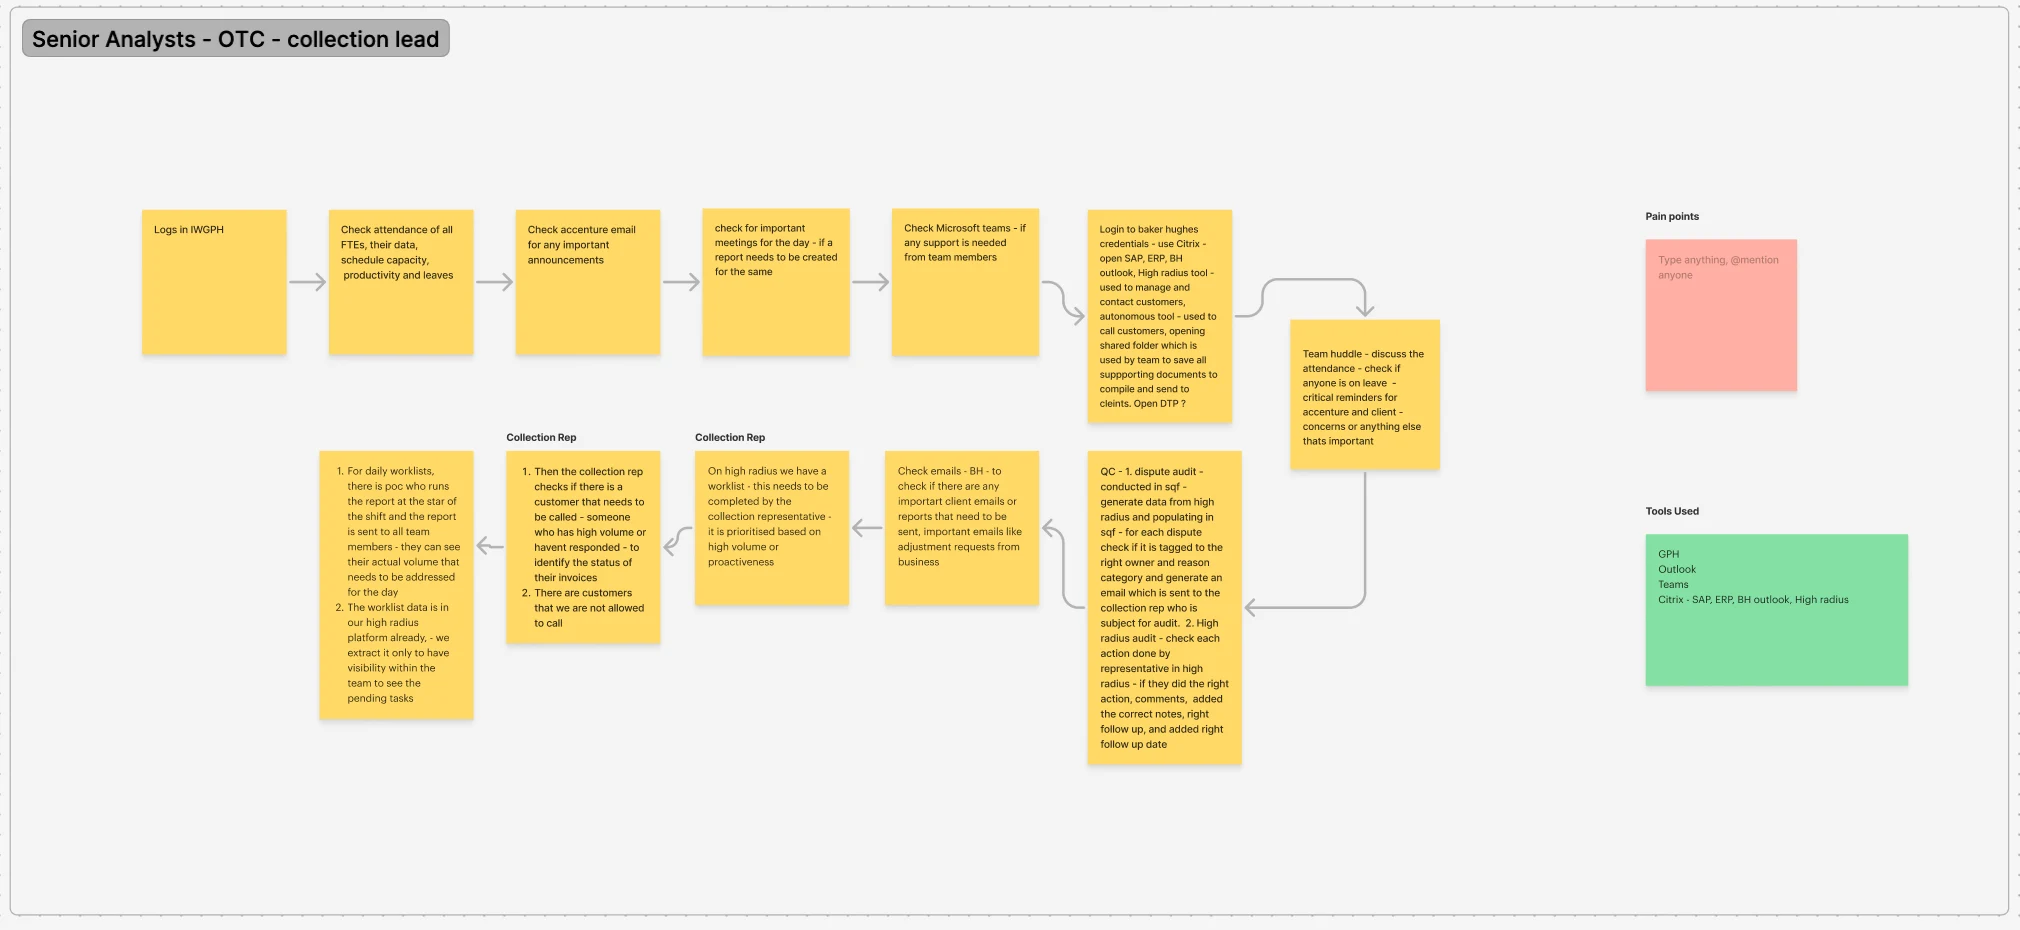
User Flows
The Interview Notes and Affinity Map were leveraged to develop a preliminary user flow map, outlining the key processes involved in the users’ daily activities and the corresponding tools they interact with throughout their workflows.
User Flows
The above User Flows are for the Analyst persona from the Procure to Pay and Order to Cash sub-processes
Method 4: Persona Mapping
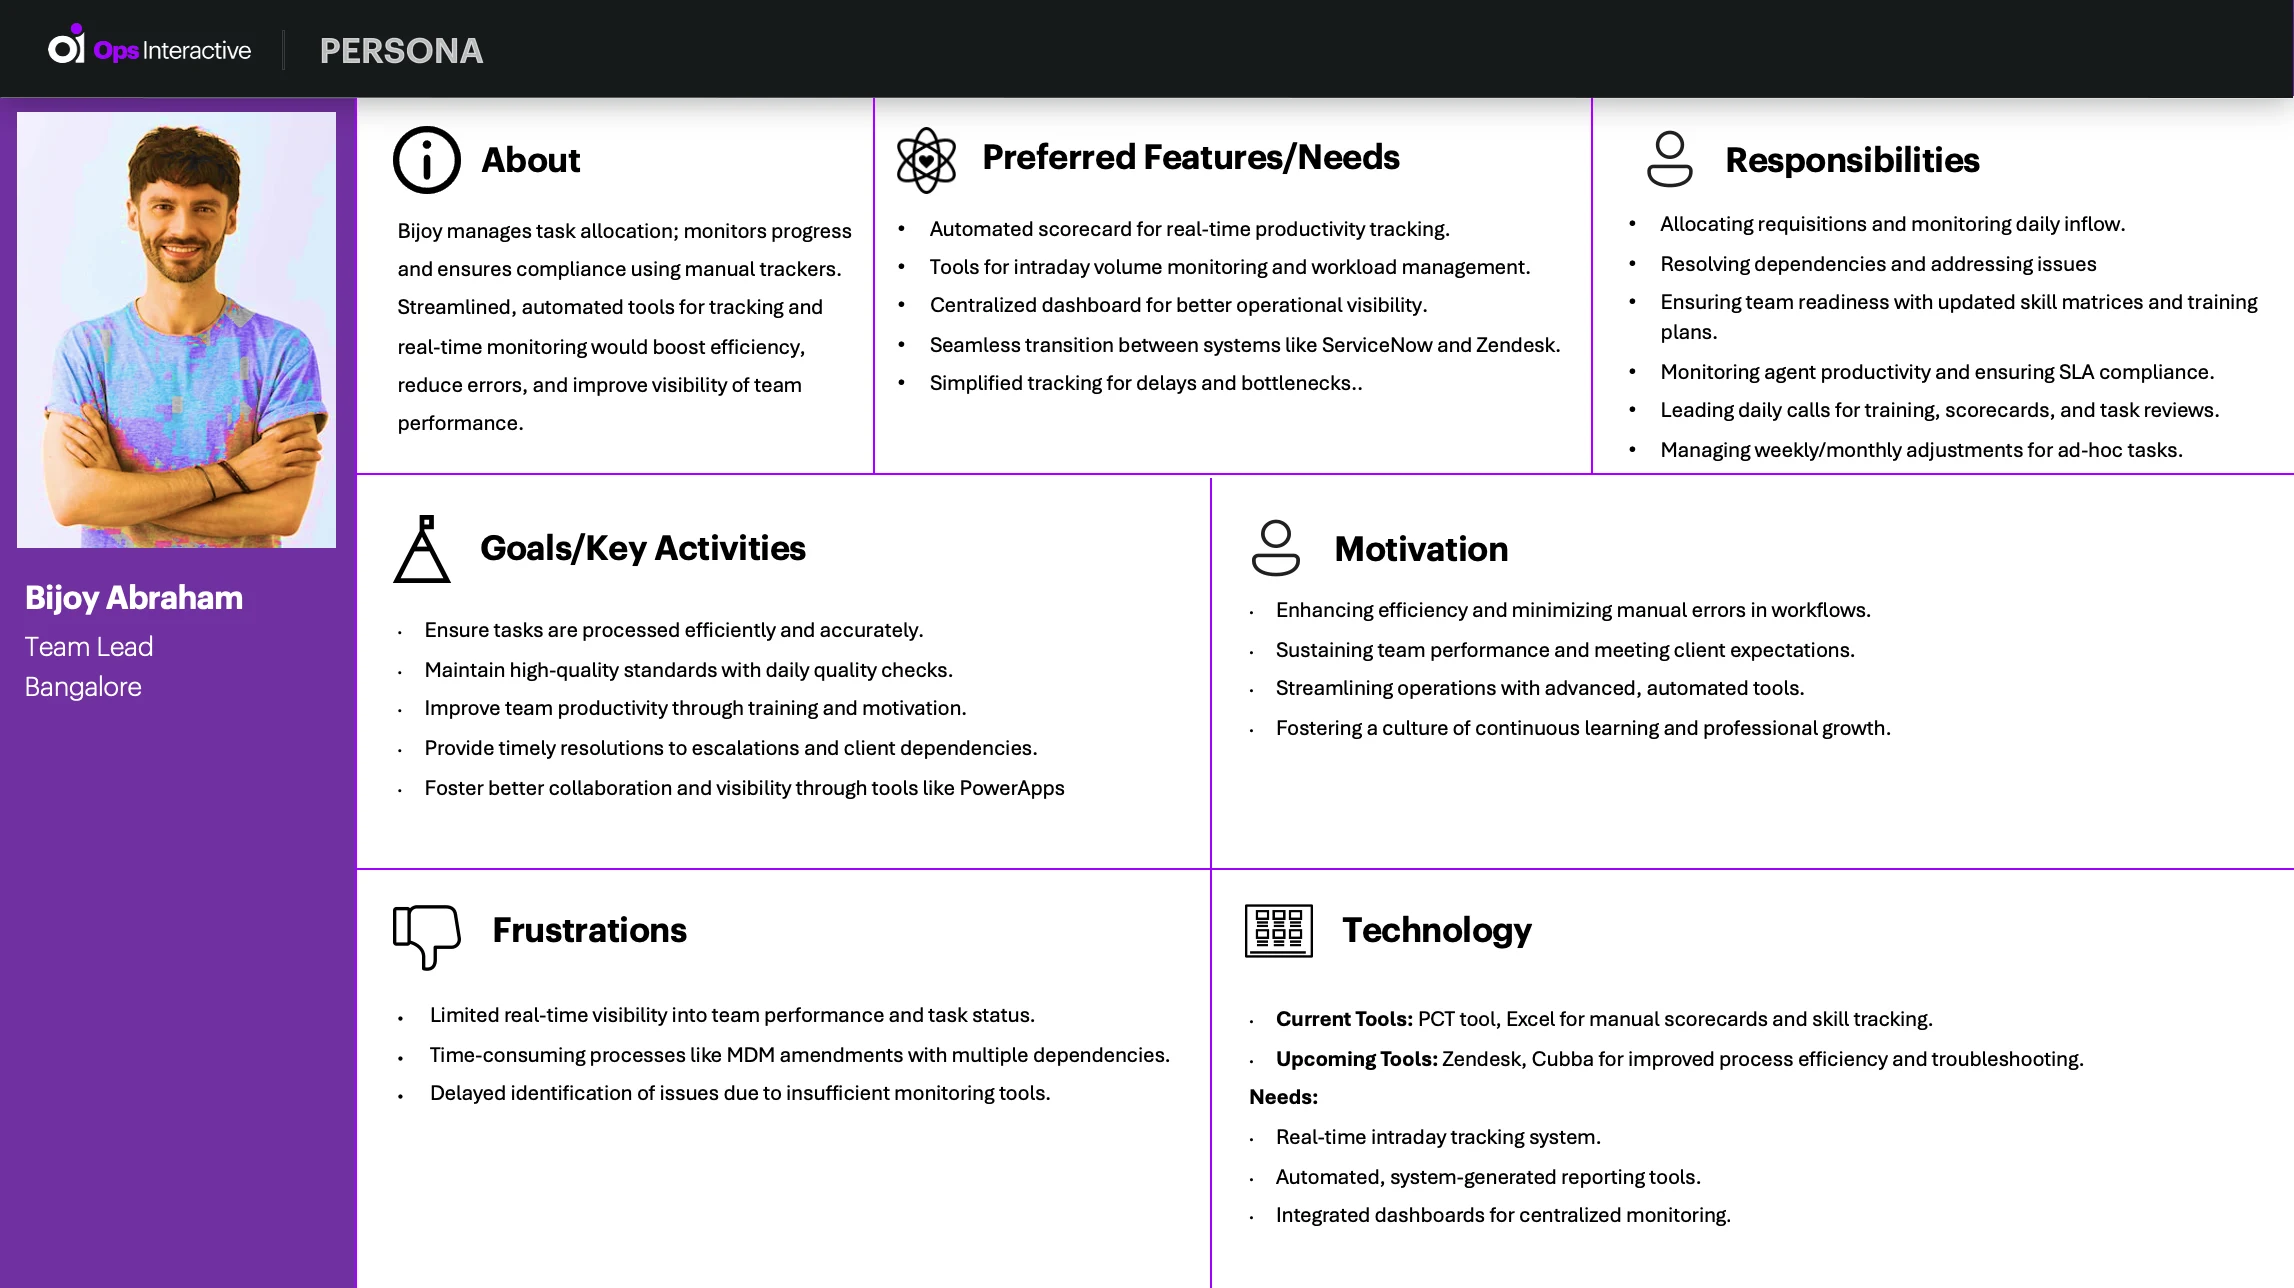
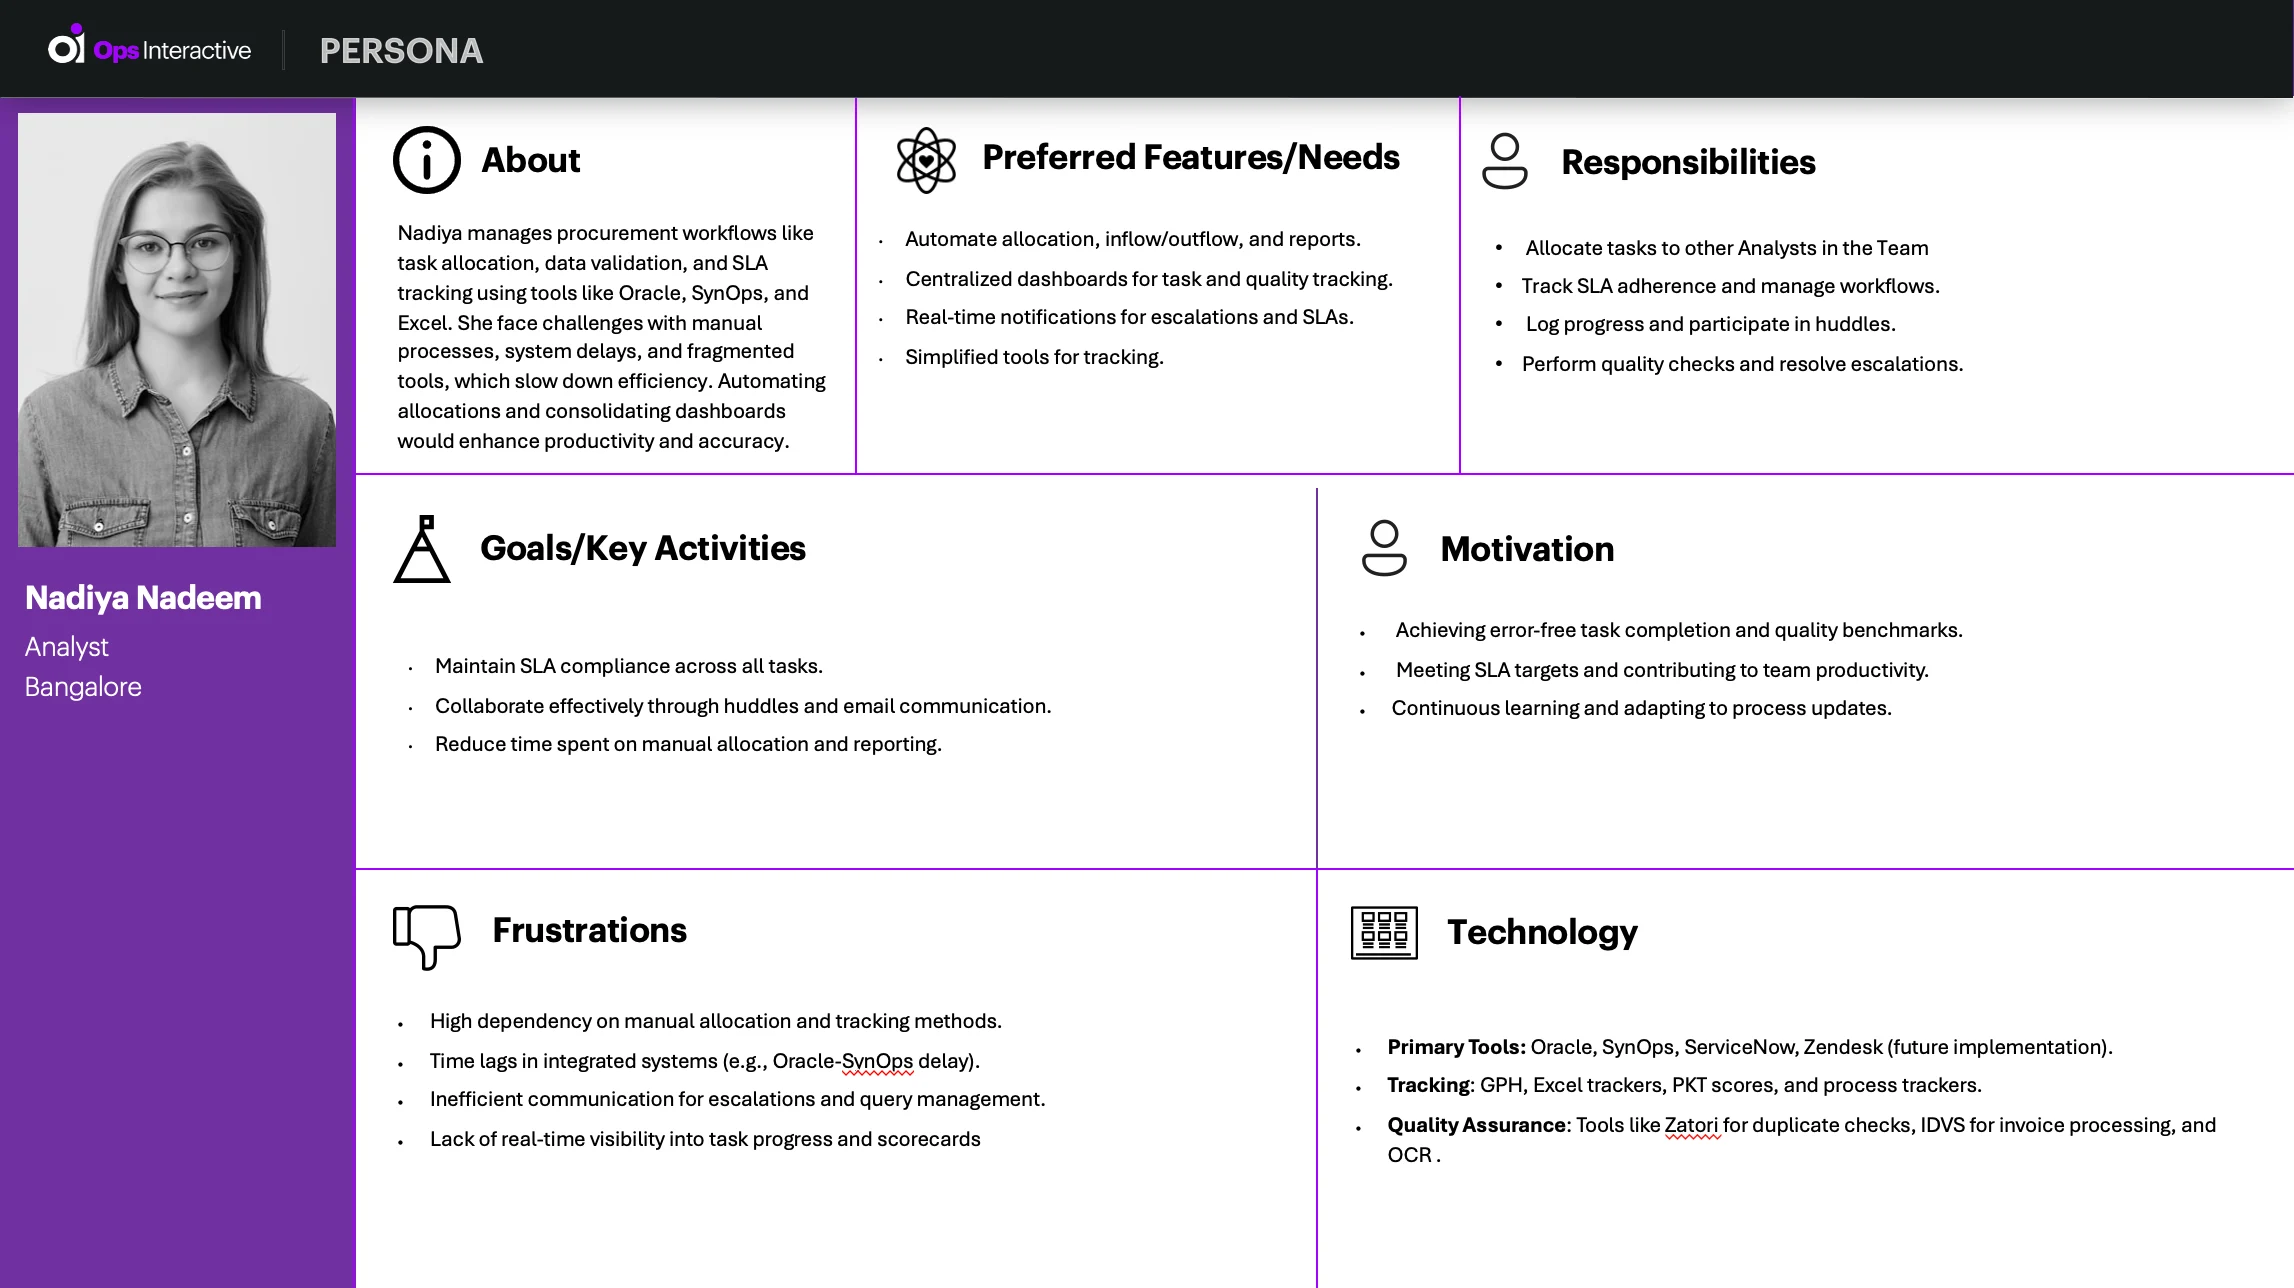
Insights gathered from the user interviews regarding daily tasks, pain points, and needs were instrumental in shaping and refining detailed user personas.
Team Lead Persona Details
Agent Persona Details
Method 5: User Journey Mapping
The data collected was synthesized and structured into a User Journey framework to uncover key emotions, pain points, and opportunities associated with each activity, based on the specific actions performed by users.
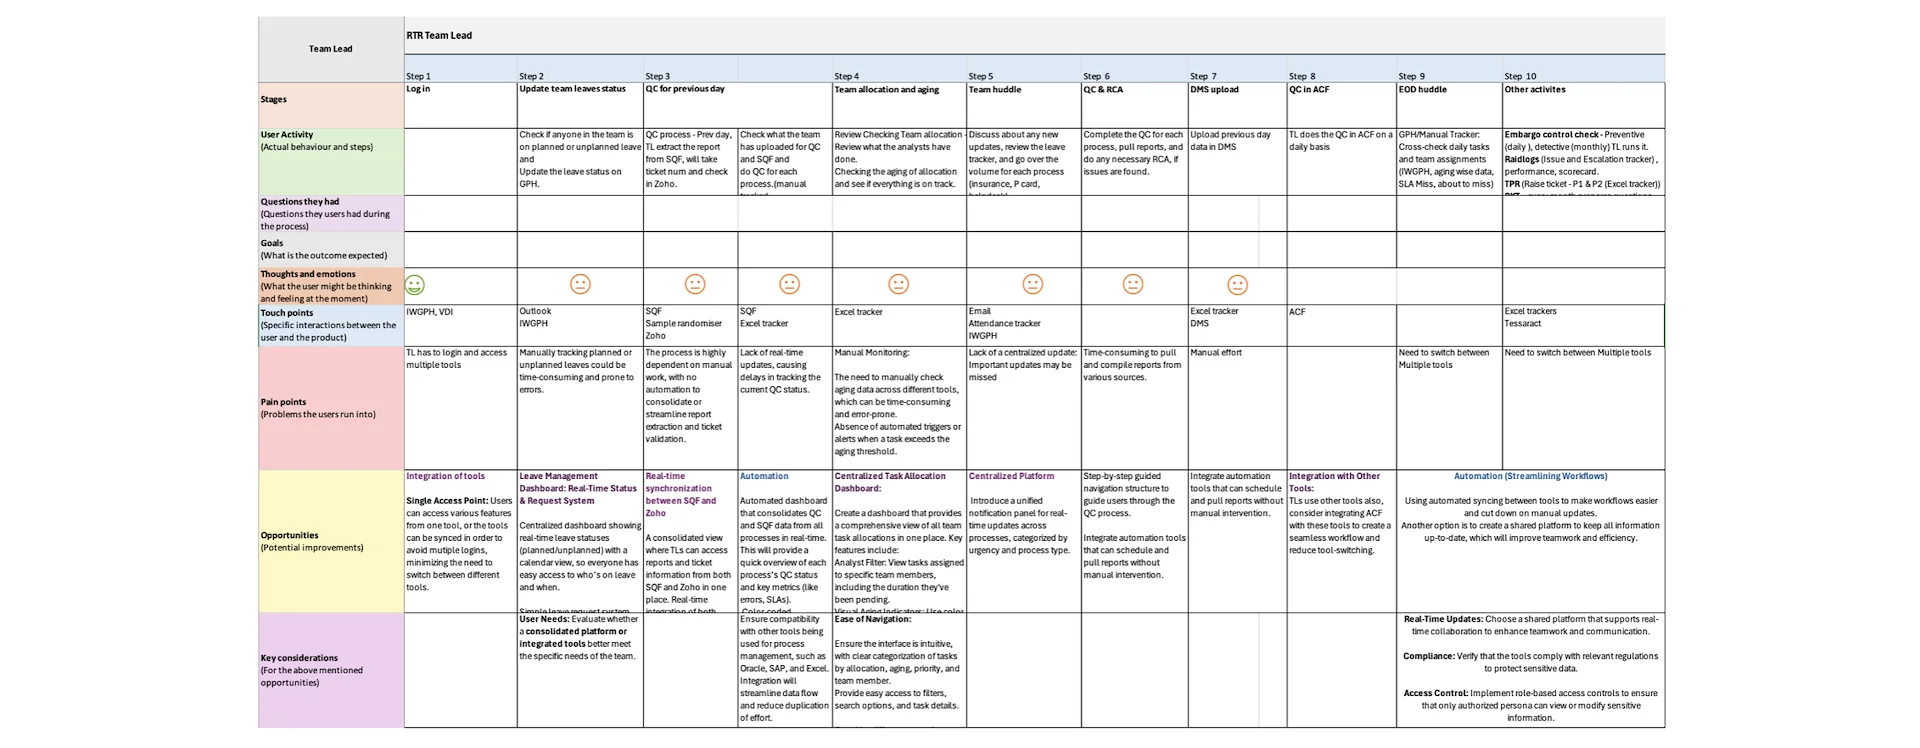
The above User Journey Map is for the Marriott account, Team Lead persona, for the Record to Report sub-process
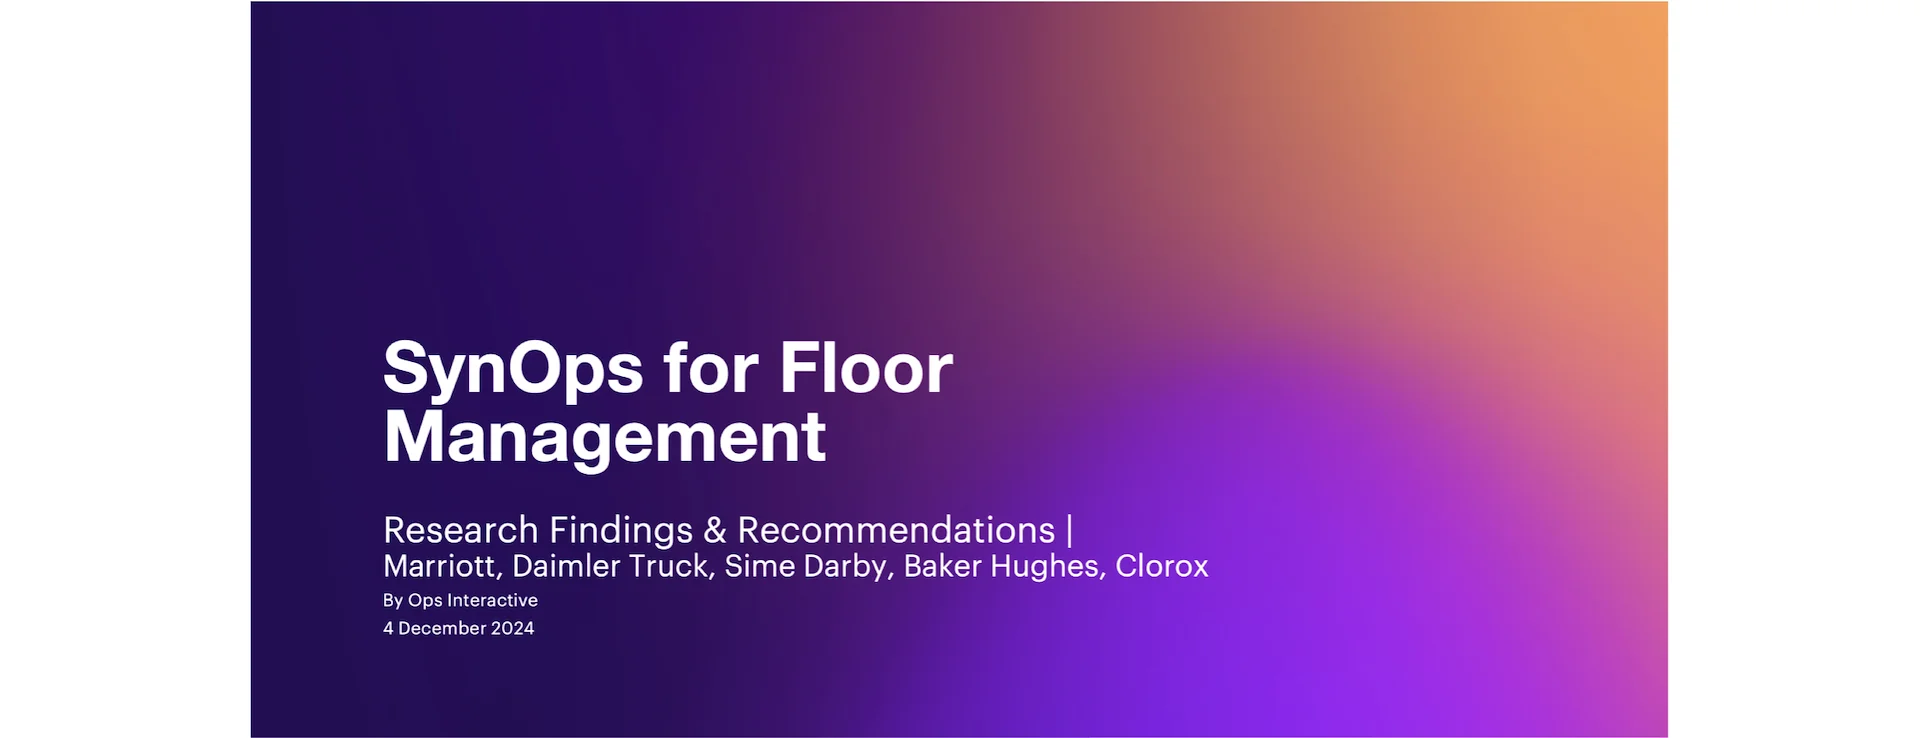
Final Research Deliverable: Insights Report
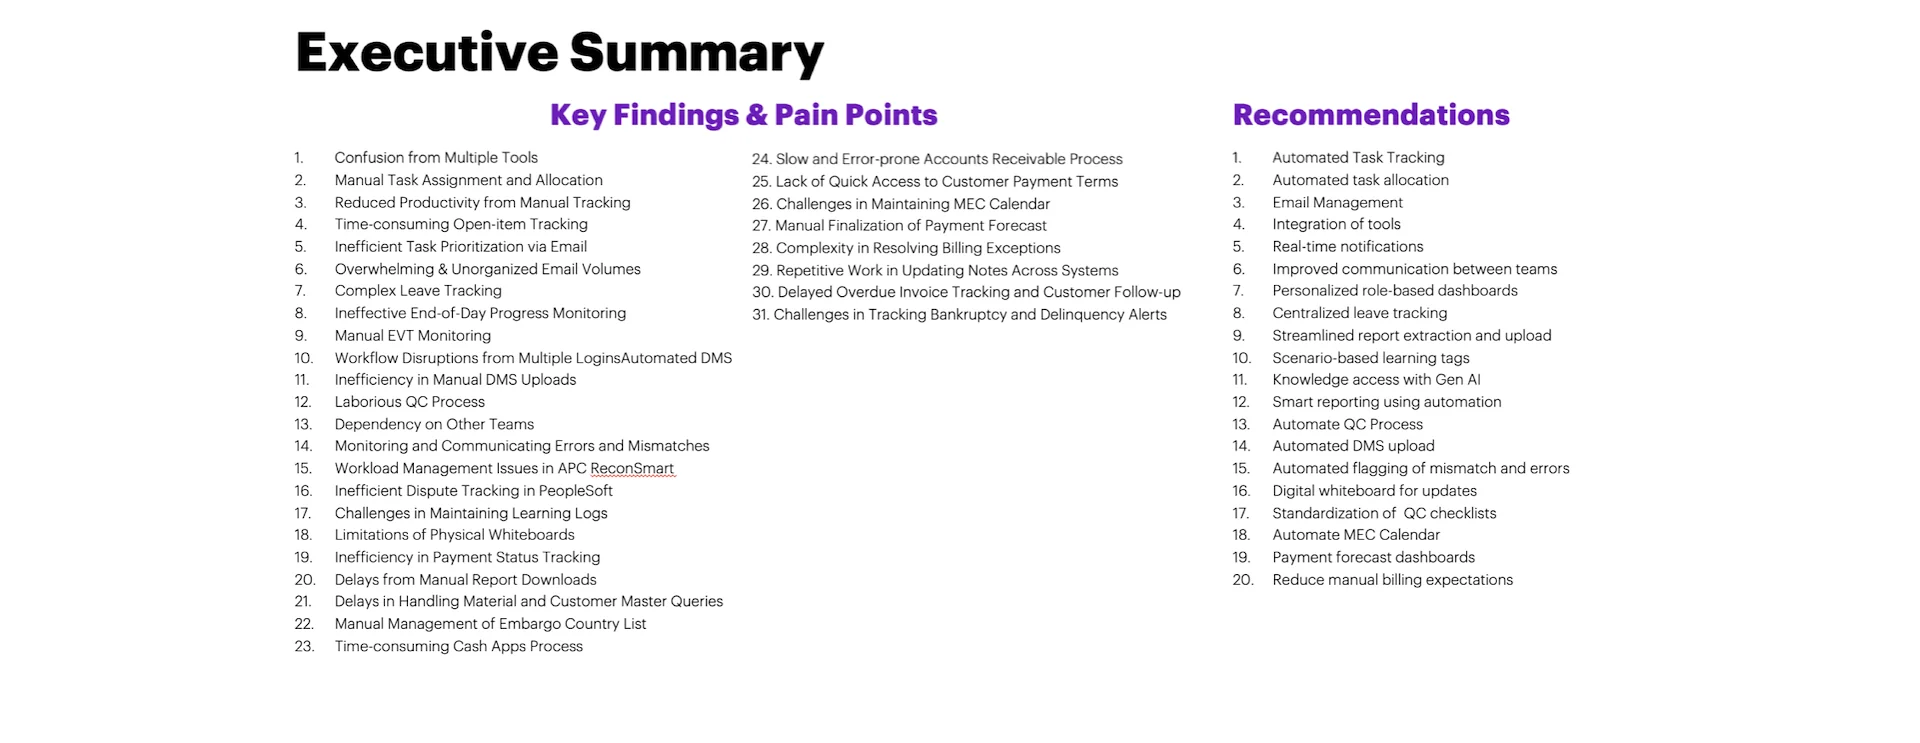
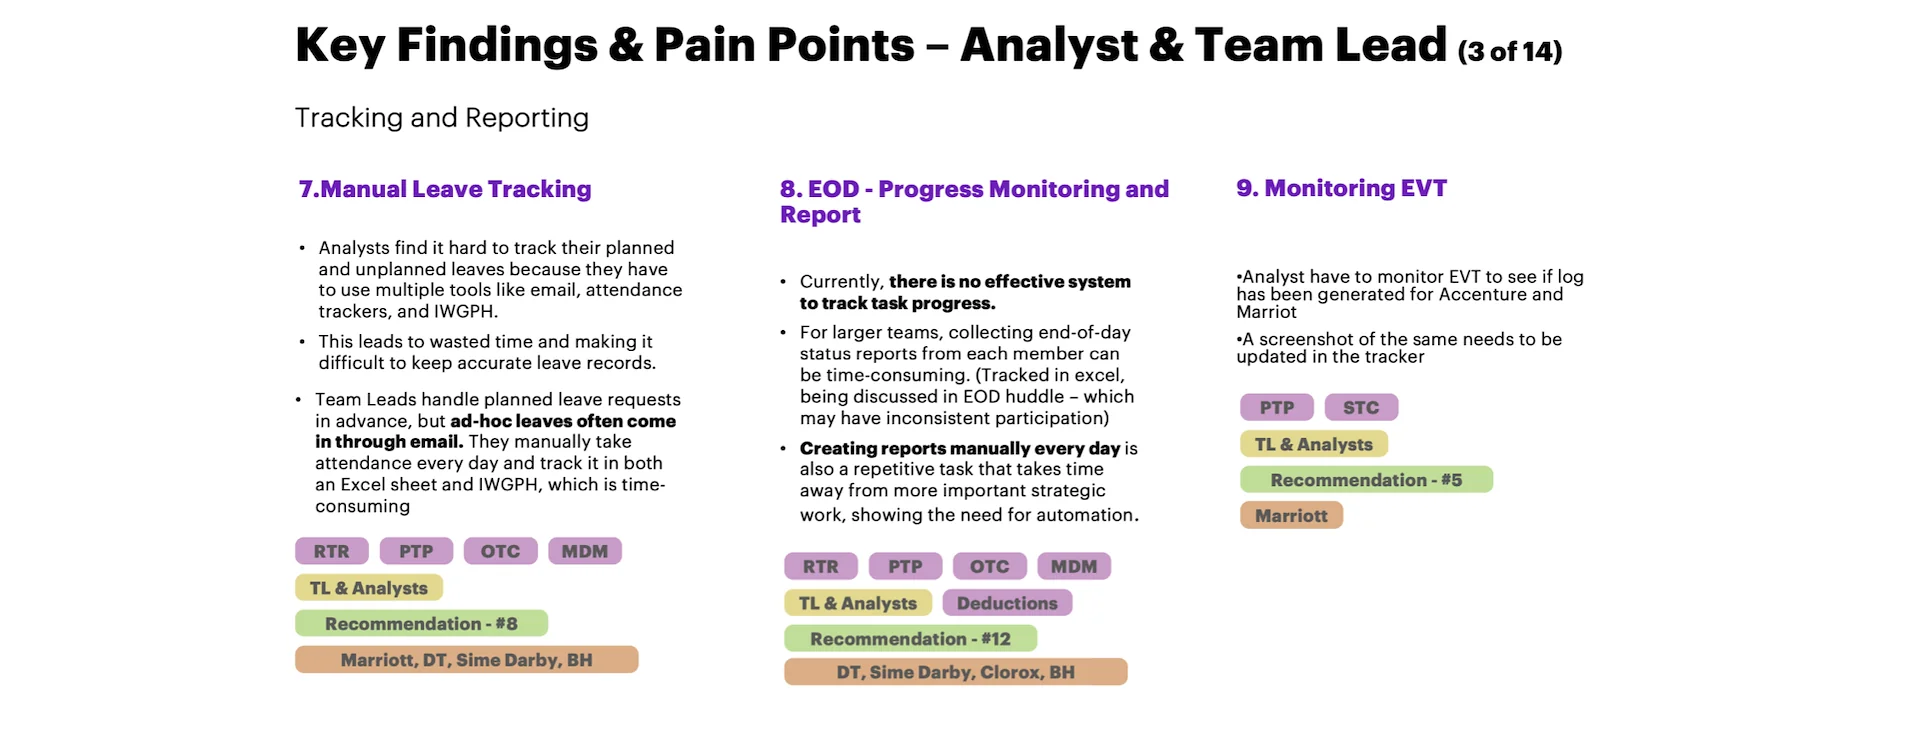
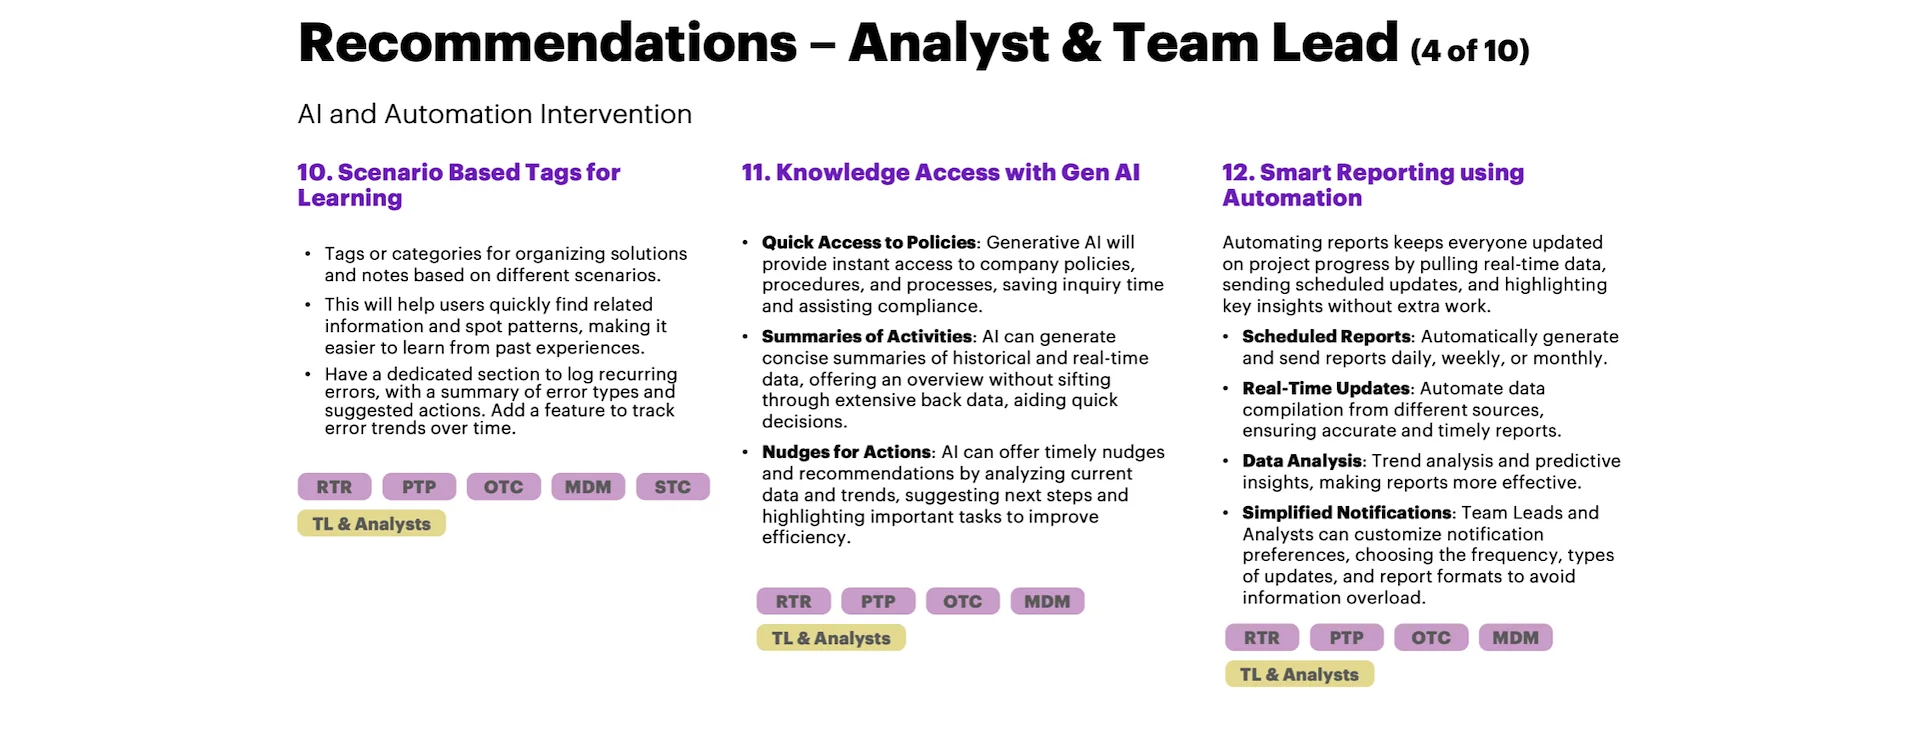
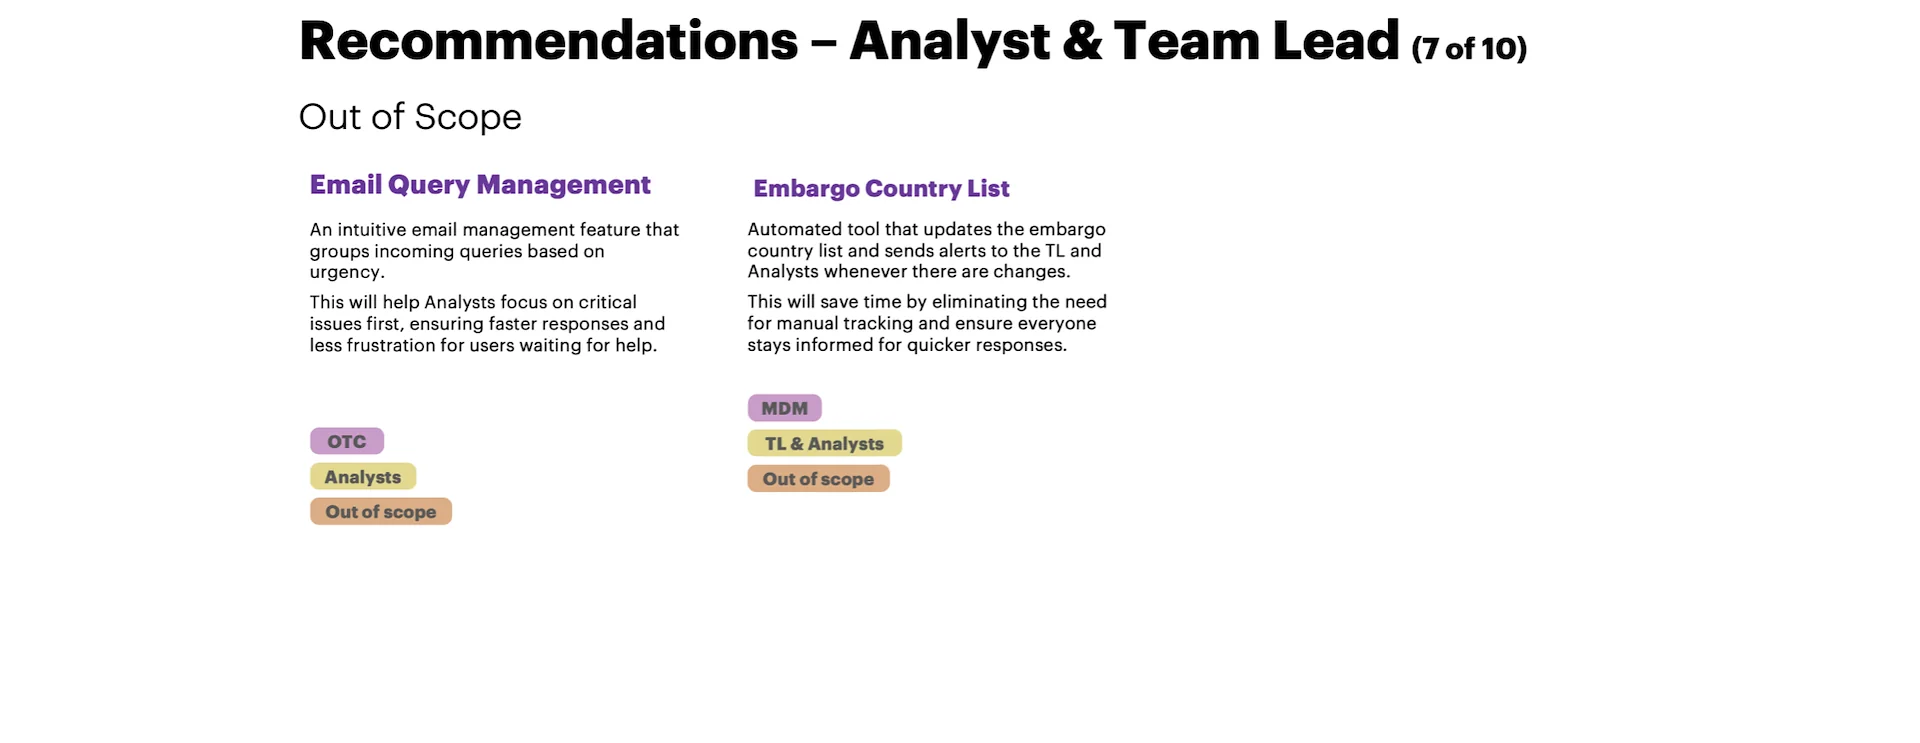
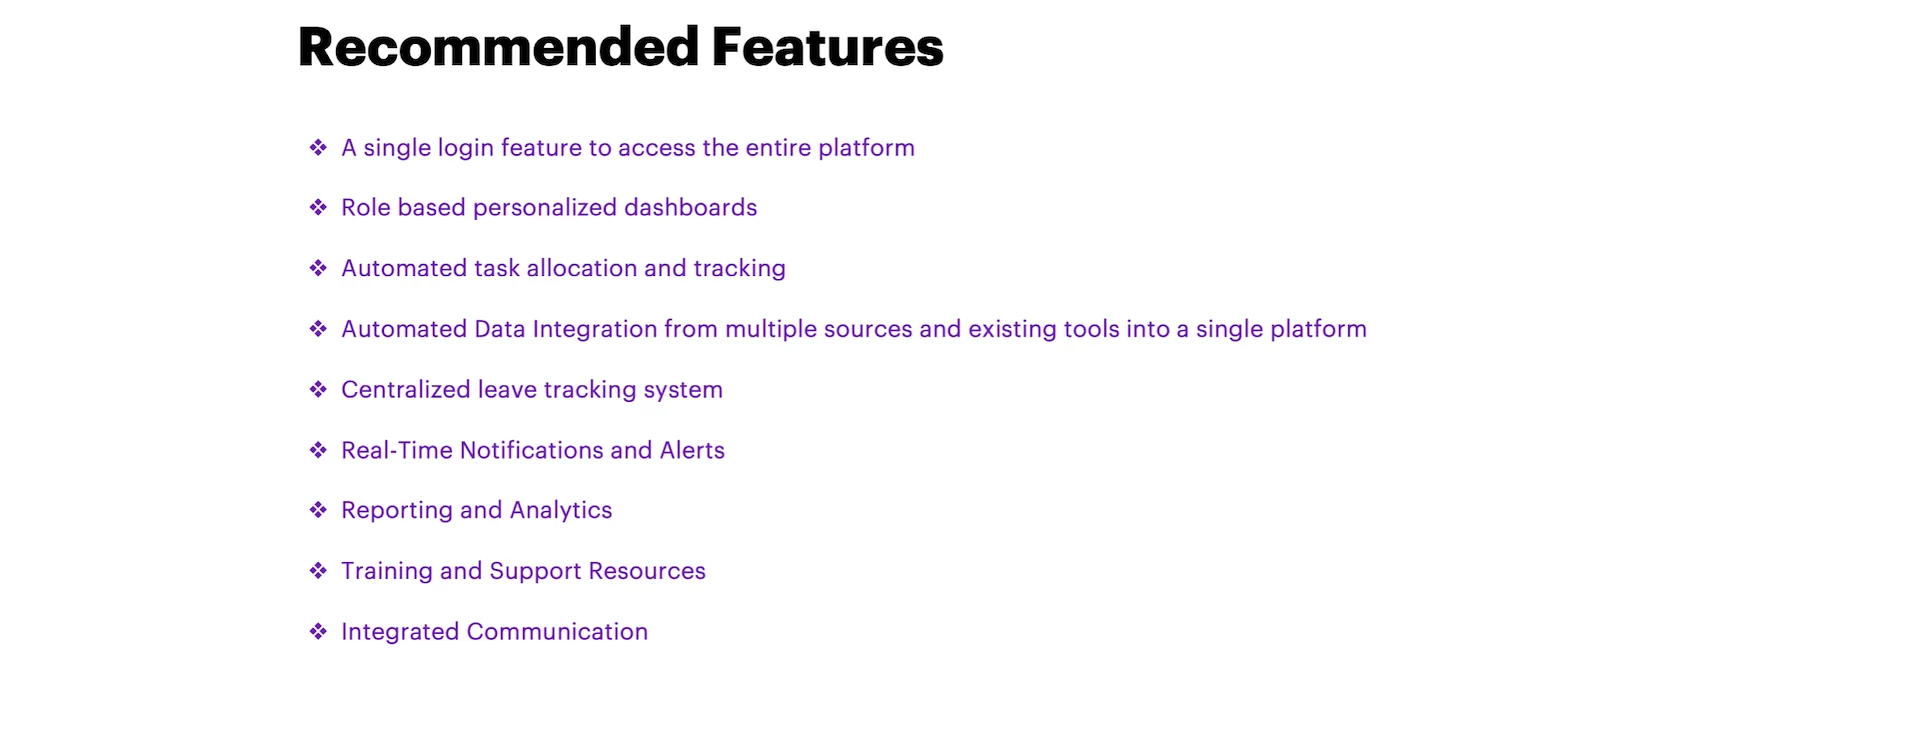
All findings up to this stage were consolidated into a comprehensive Insights Report, highlighting both common and unique pain points across business functions.
The report also included actionable recommendations tailored to address identified challenges and support informed decision-making. Here are some of the slides from this report:
Wireframe &
Concept generation
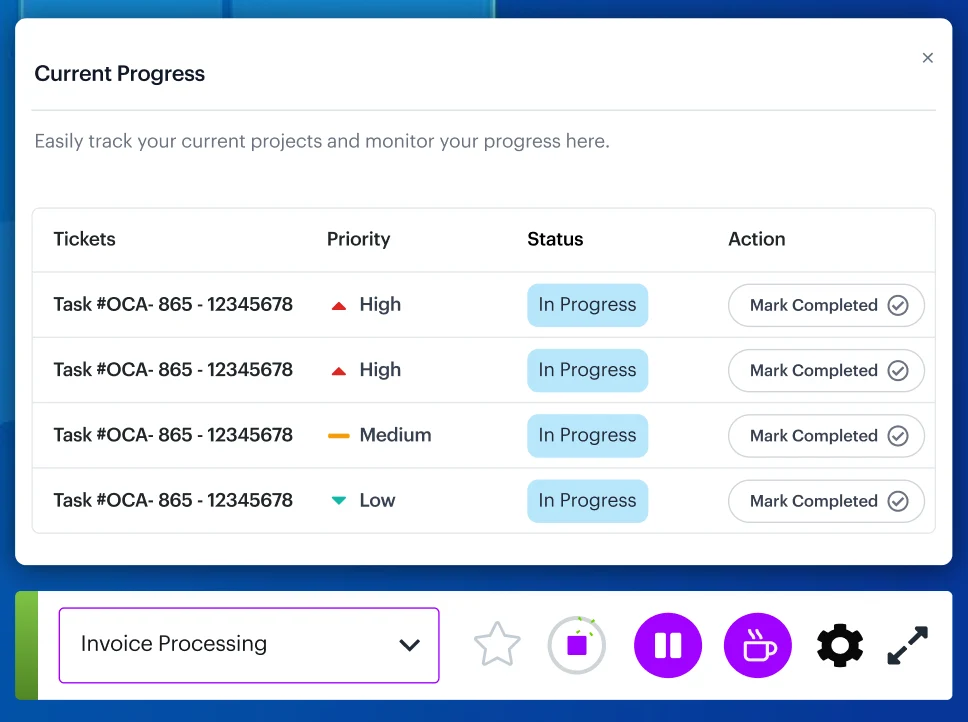
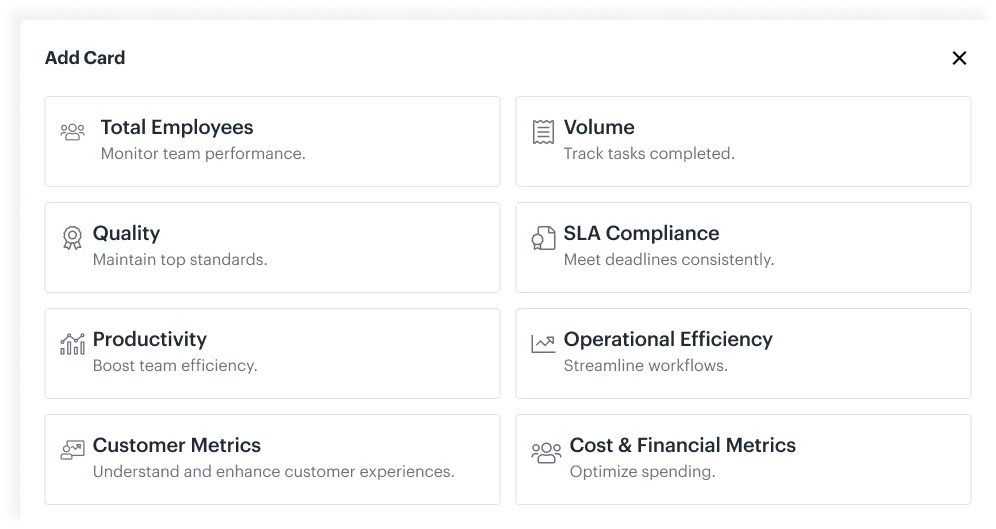
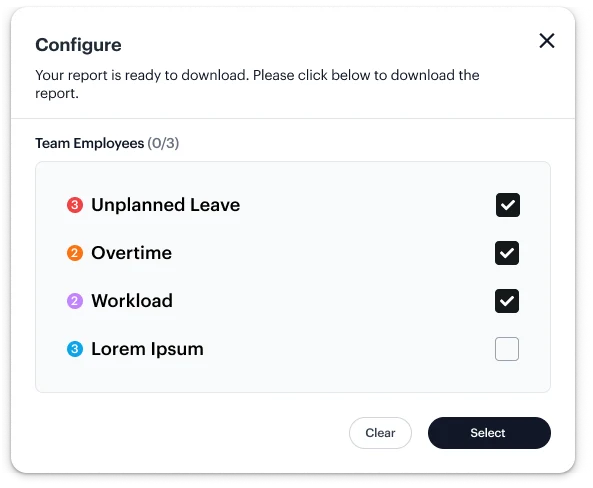
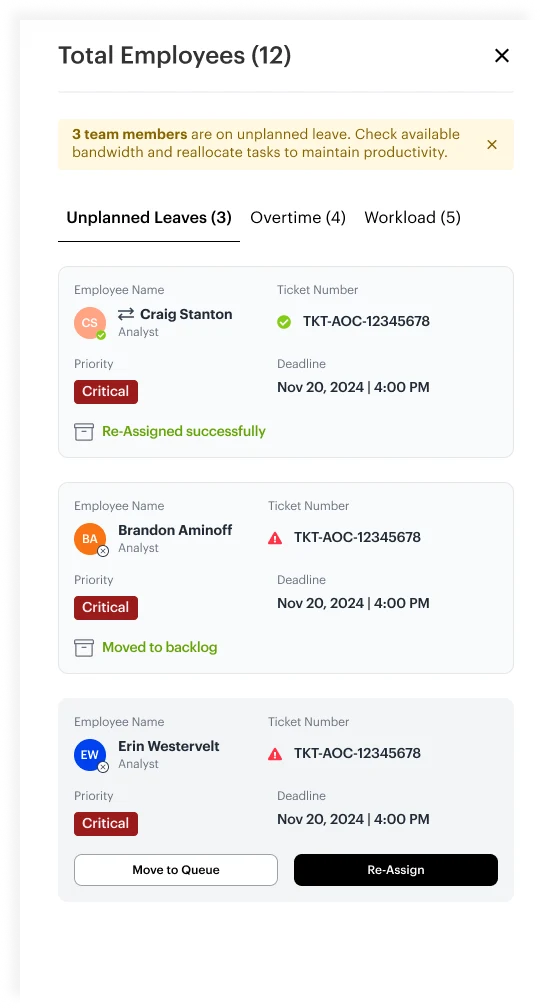
Upon completion of the research phase, we initiated the concept development for our proposed solution. This process began with the creation of low-fidelity wireframes, which were progressively refined into mid- and high-fidelity designs to enhance clarity, functionality, and visual detail.
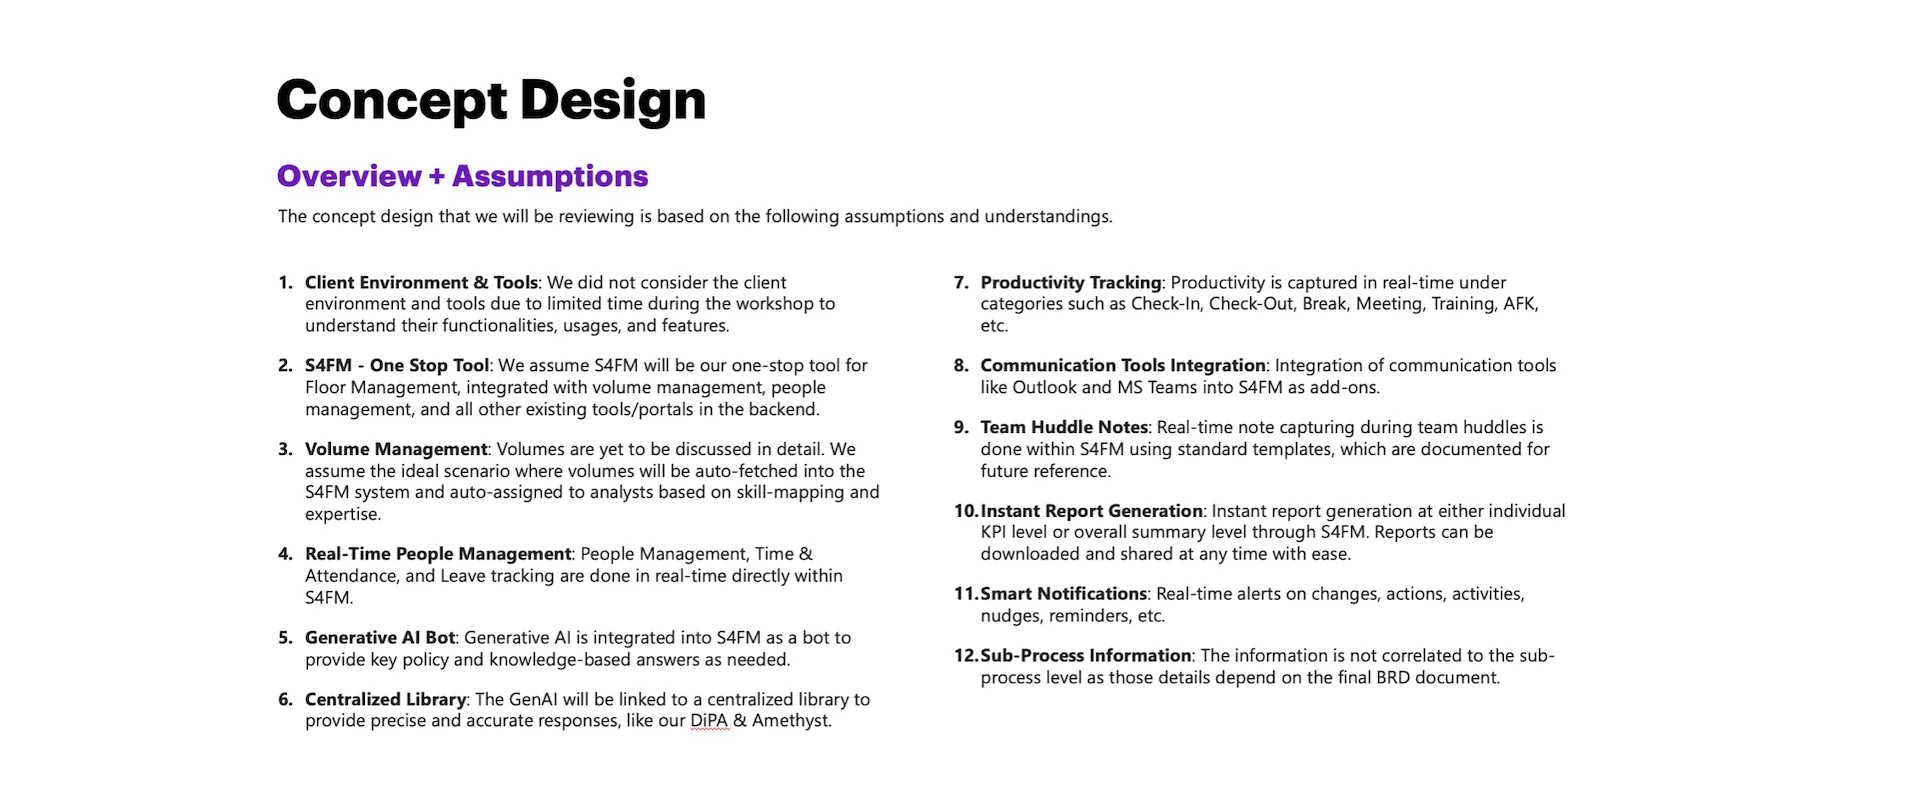
The concepts were based on the following assumptions and understandings:
Low-fidelity concepts were initially developed to explore and communicate the core structure and functionality of the solution. These early-stage designs focused on layout, user flow, and key interactions, serving as a foundation for further refinement
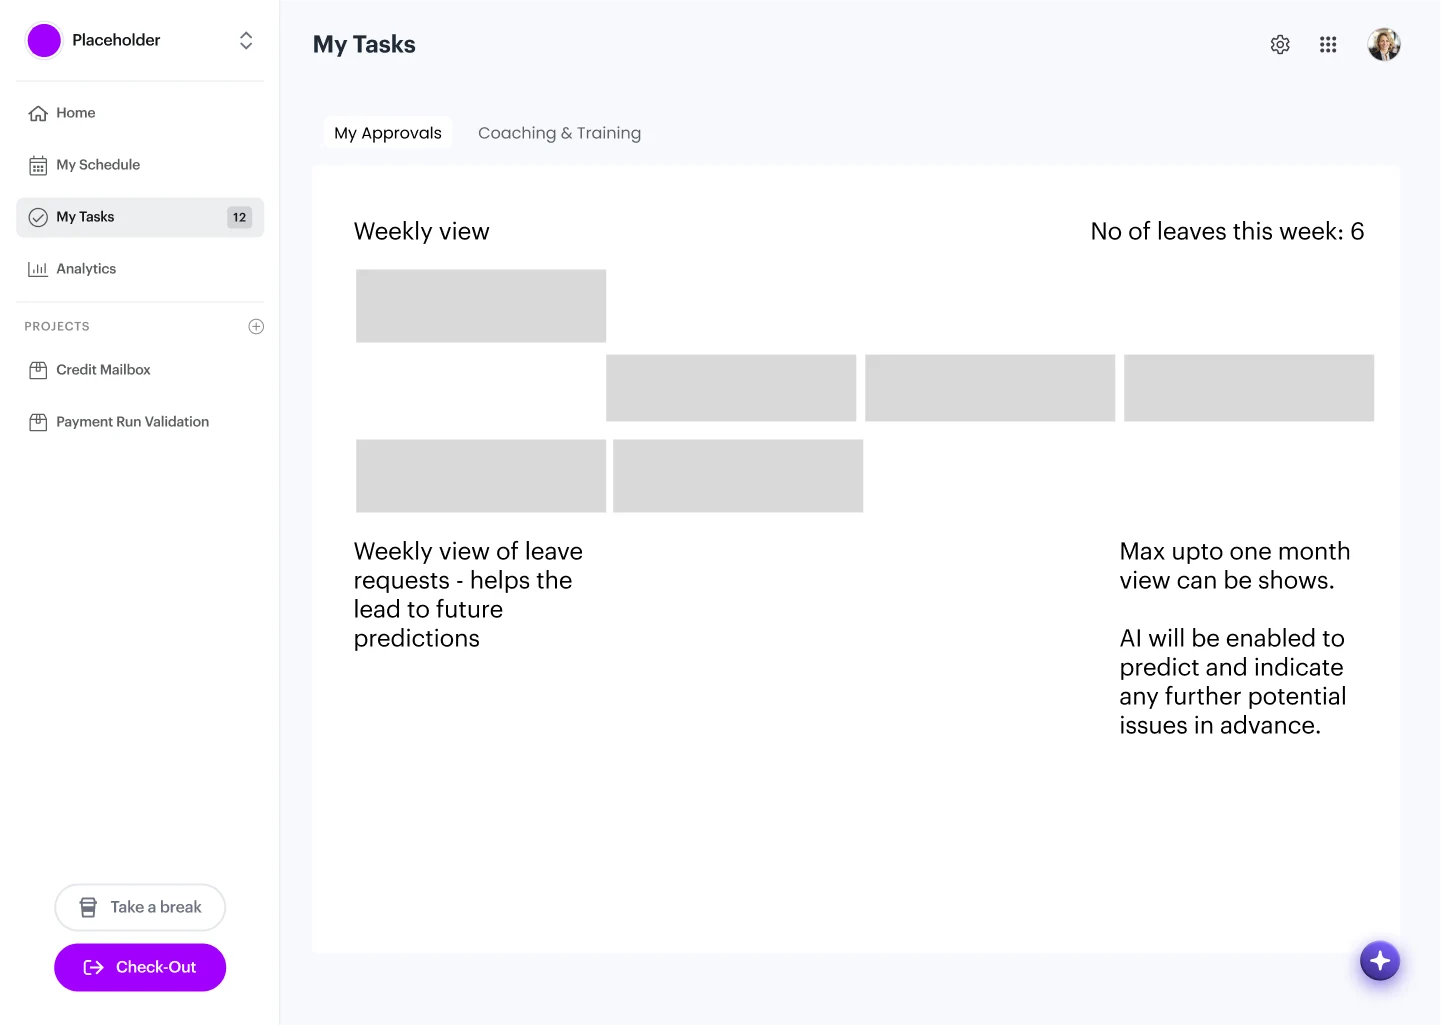
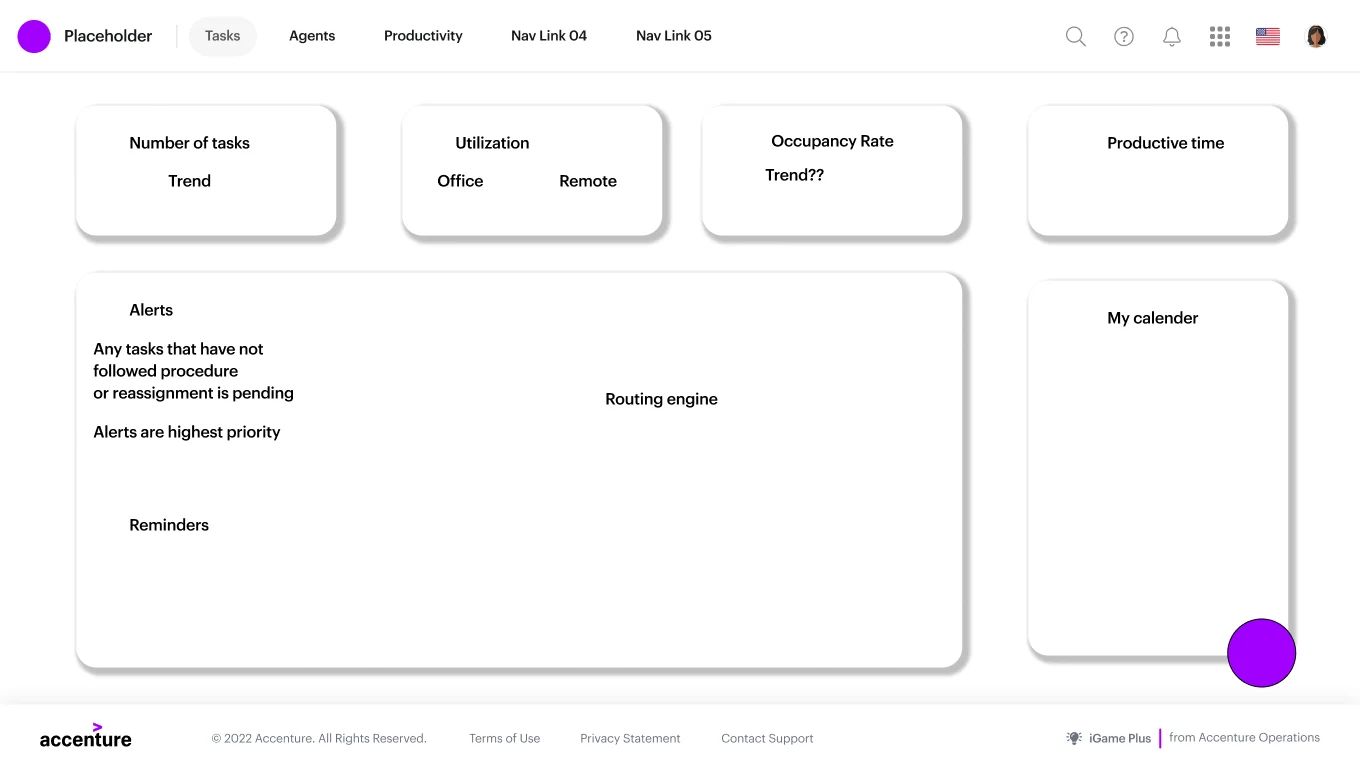
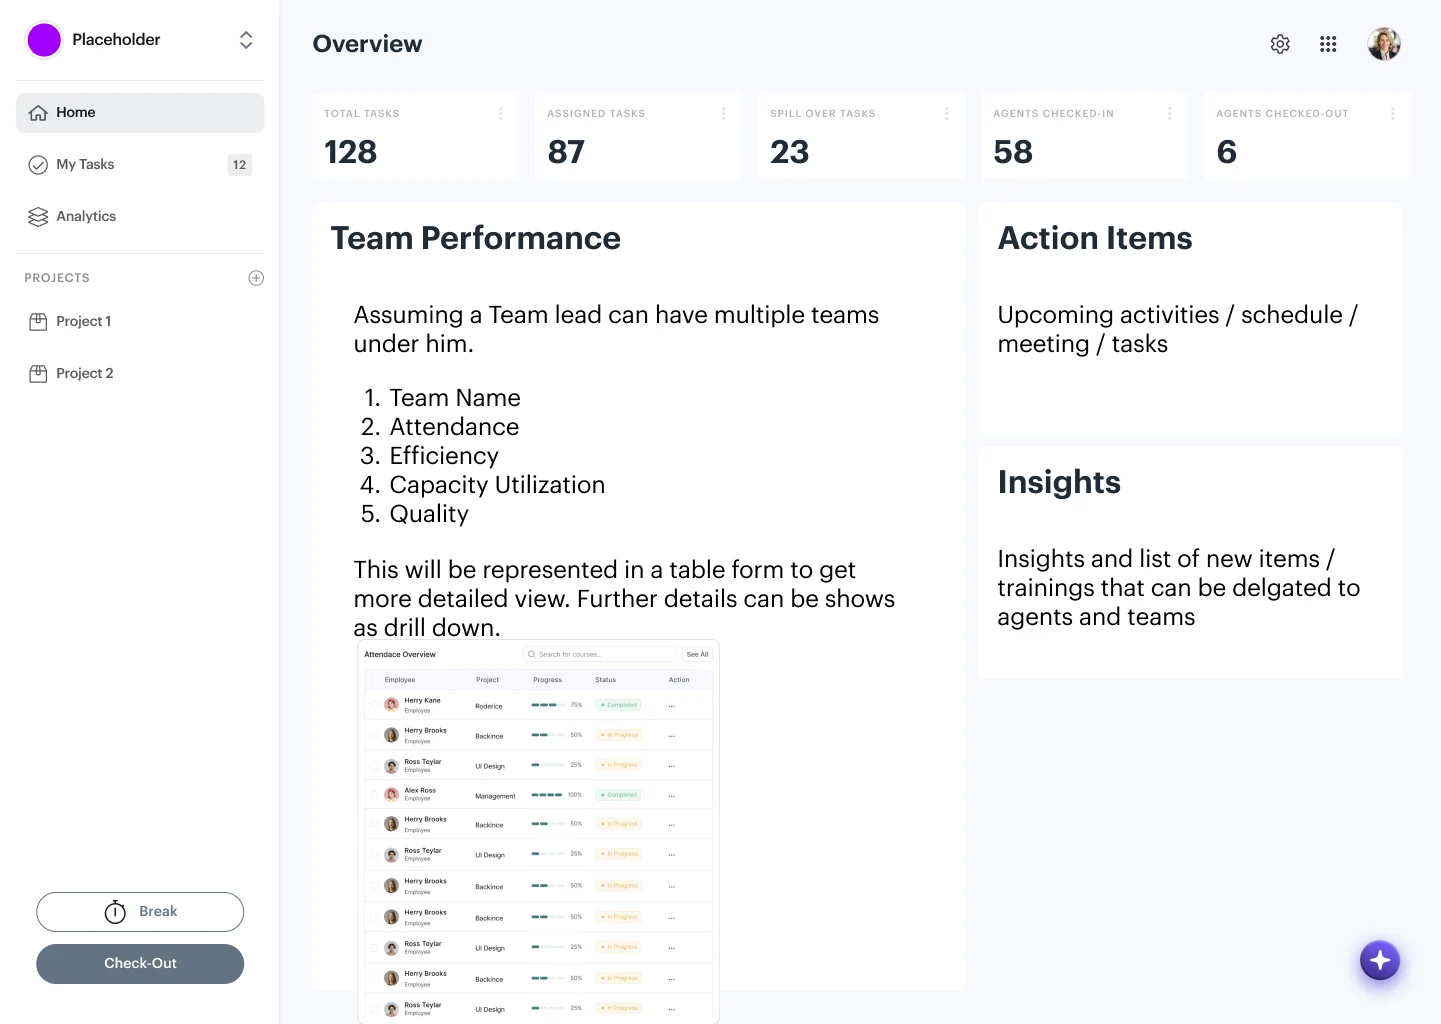
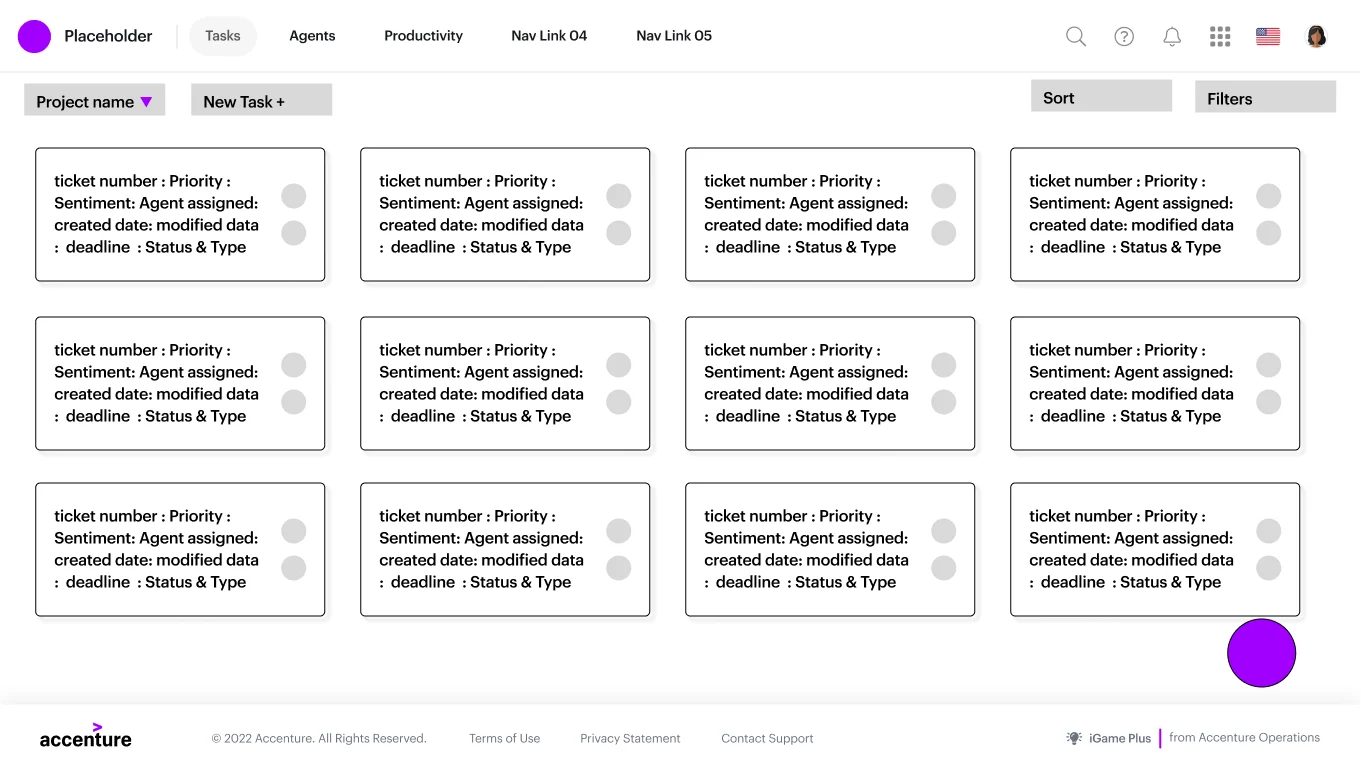
Mid-fidelity concepts were created to build upon the foundational structure established in the low-fidelity stage. These designs incorporated more detailed layouts, defined components, appropriate data visualisation and a clearer representation of user interactions, allowing for more effective validation of functionality and user experience.
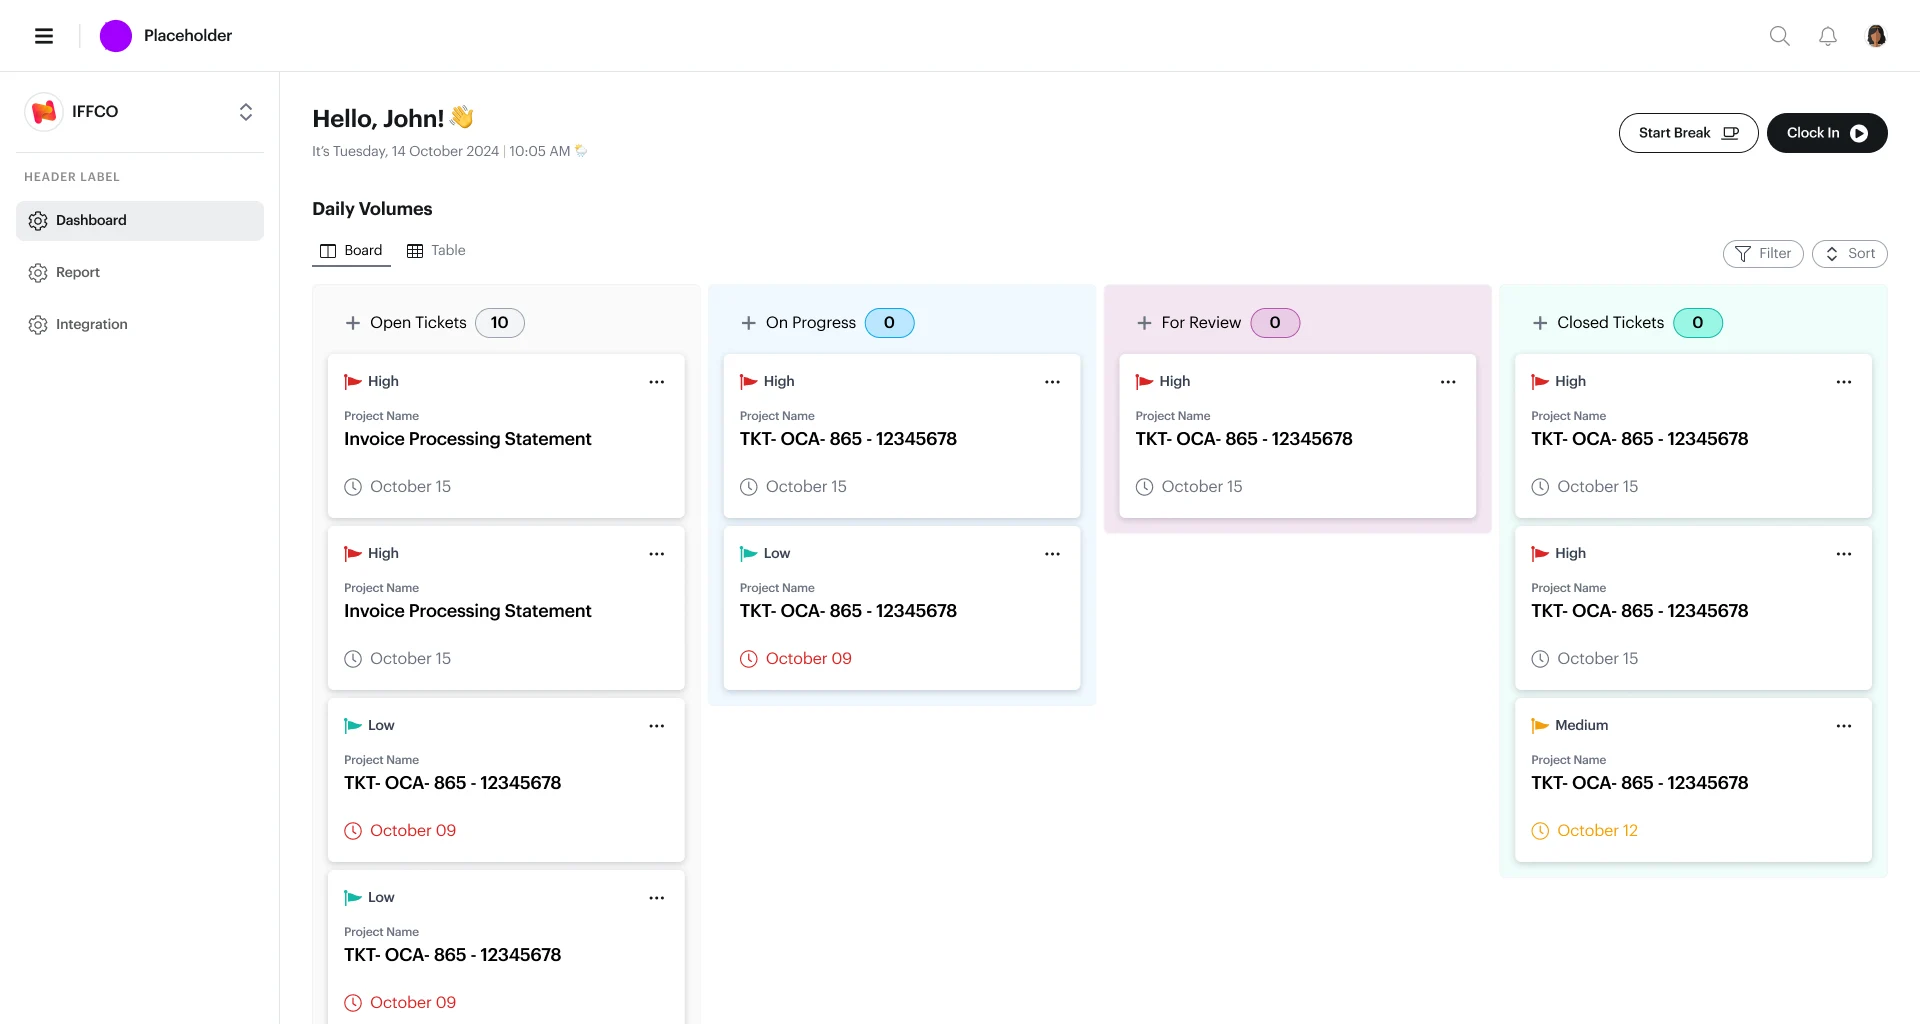
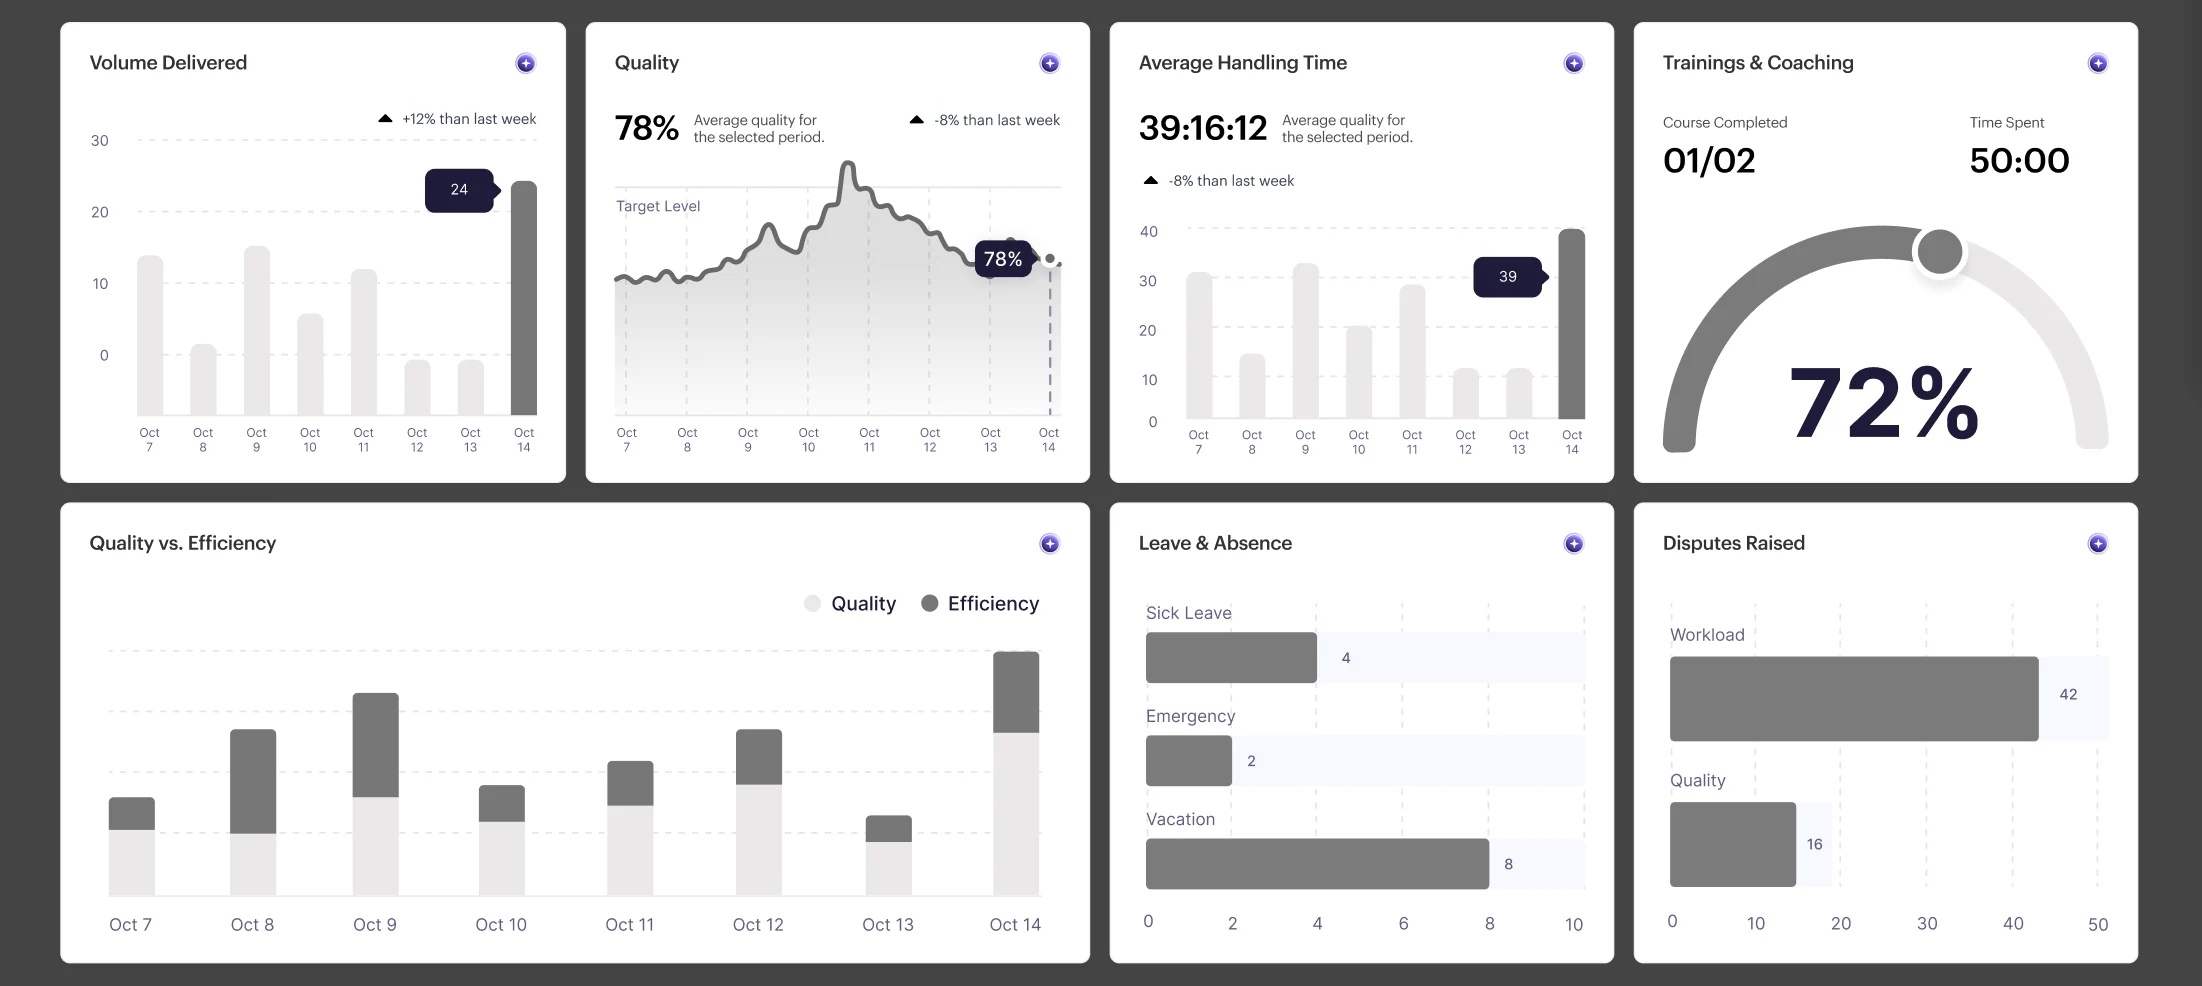
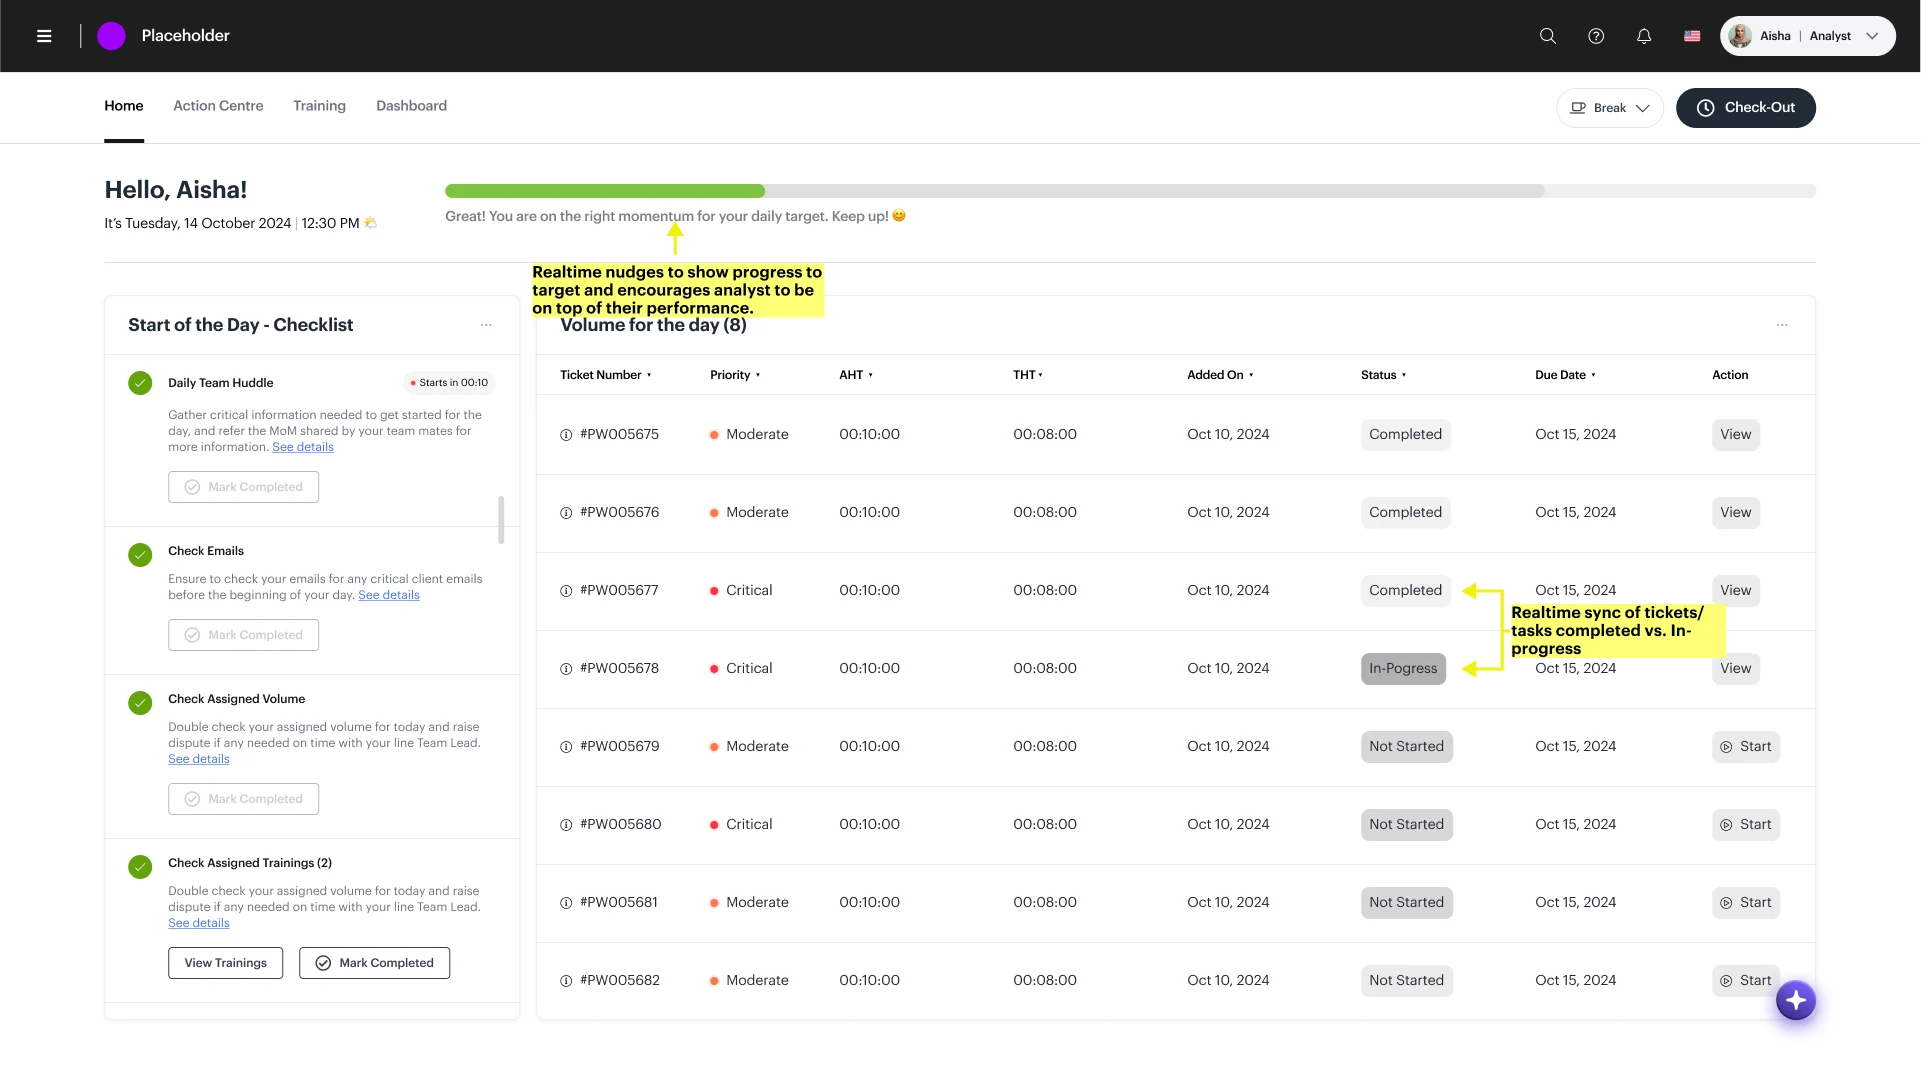
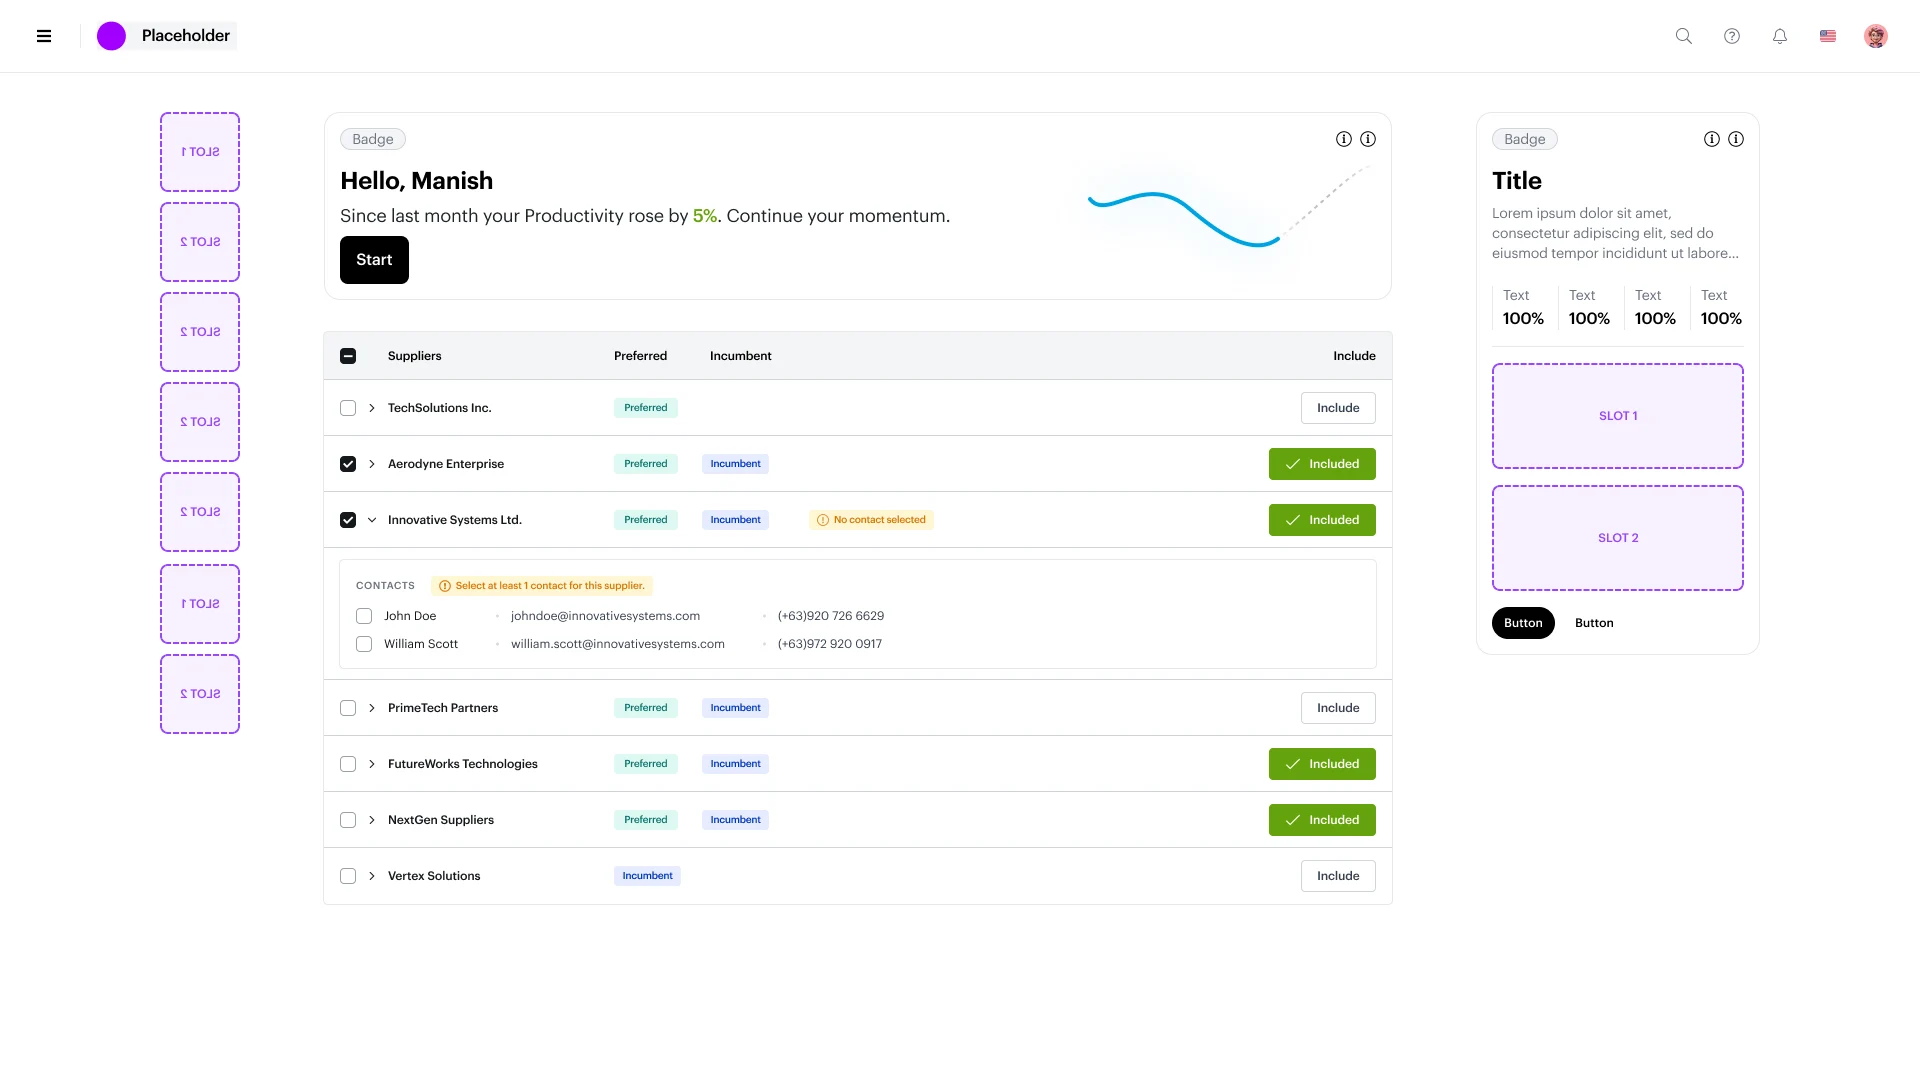
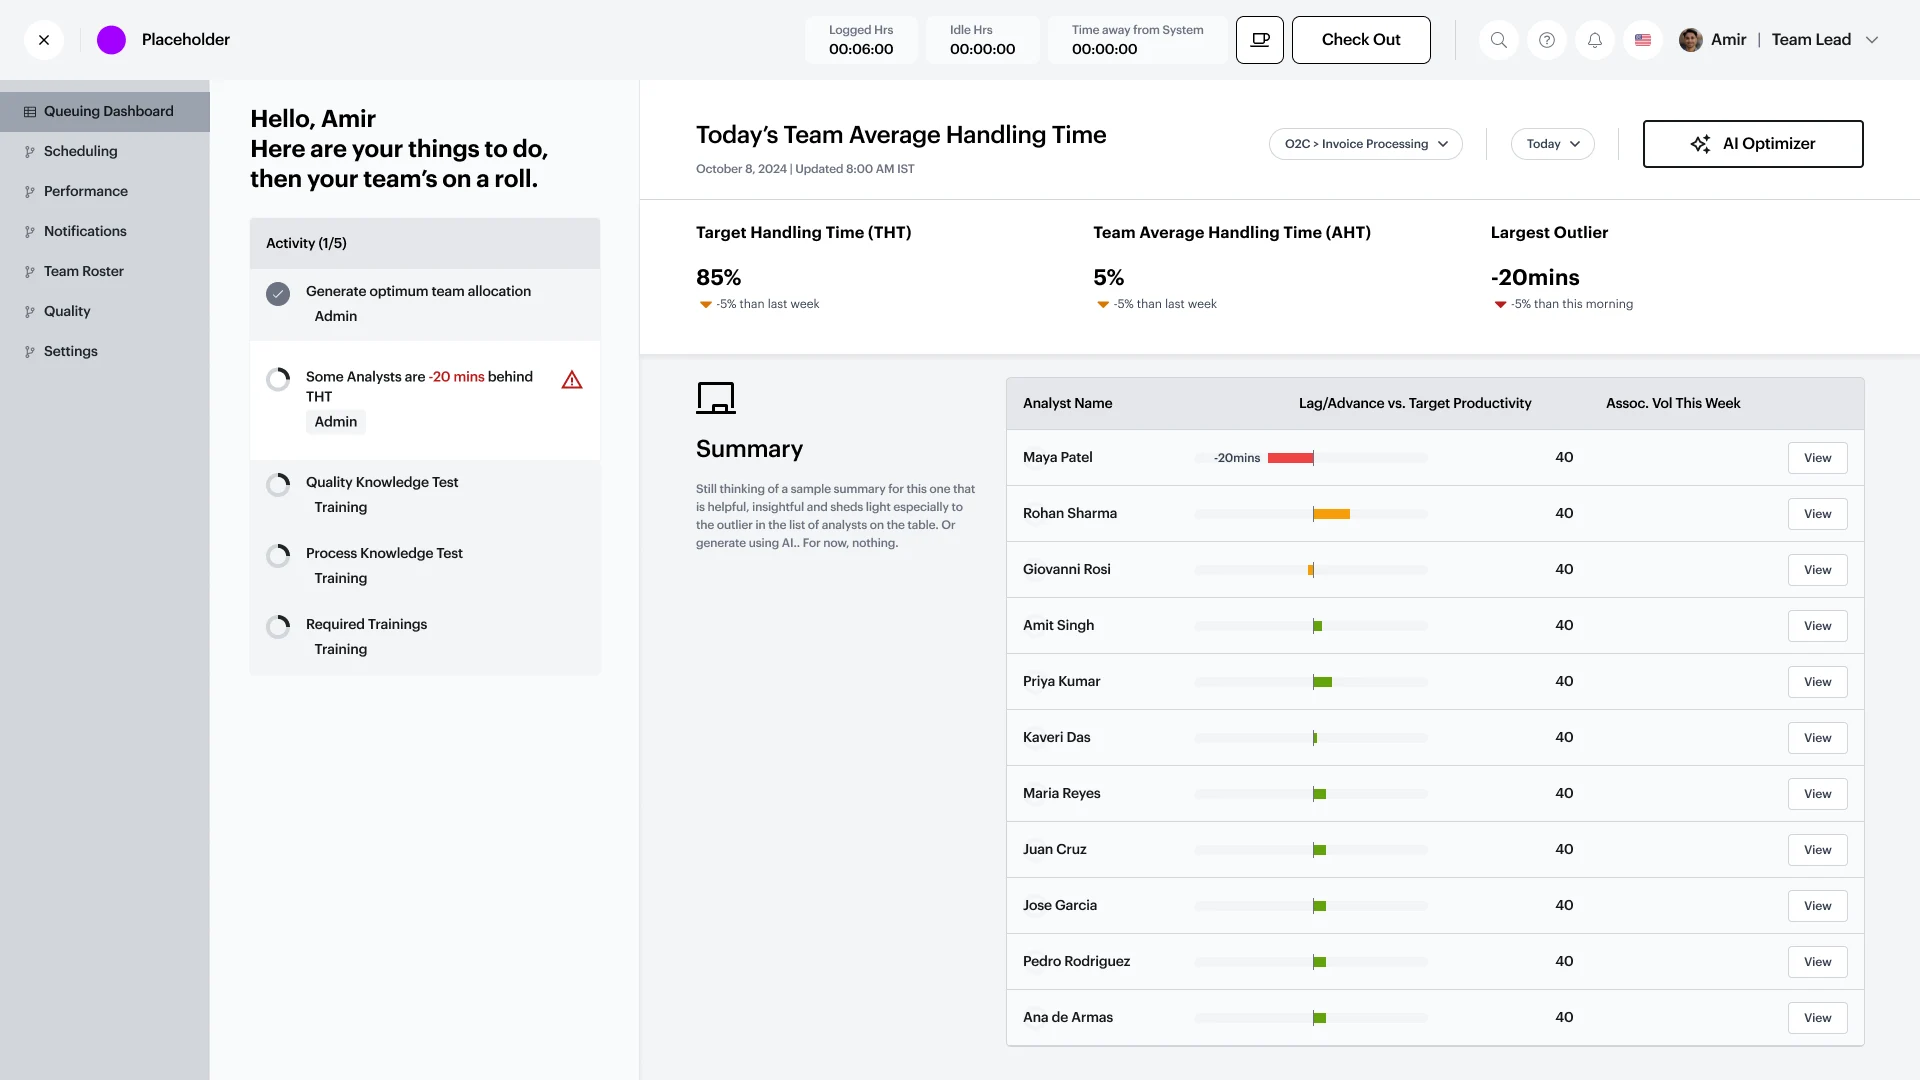
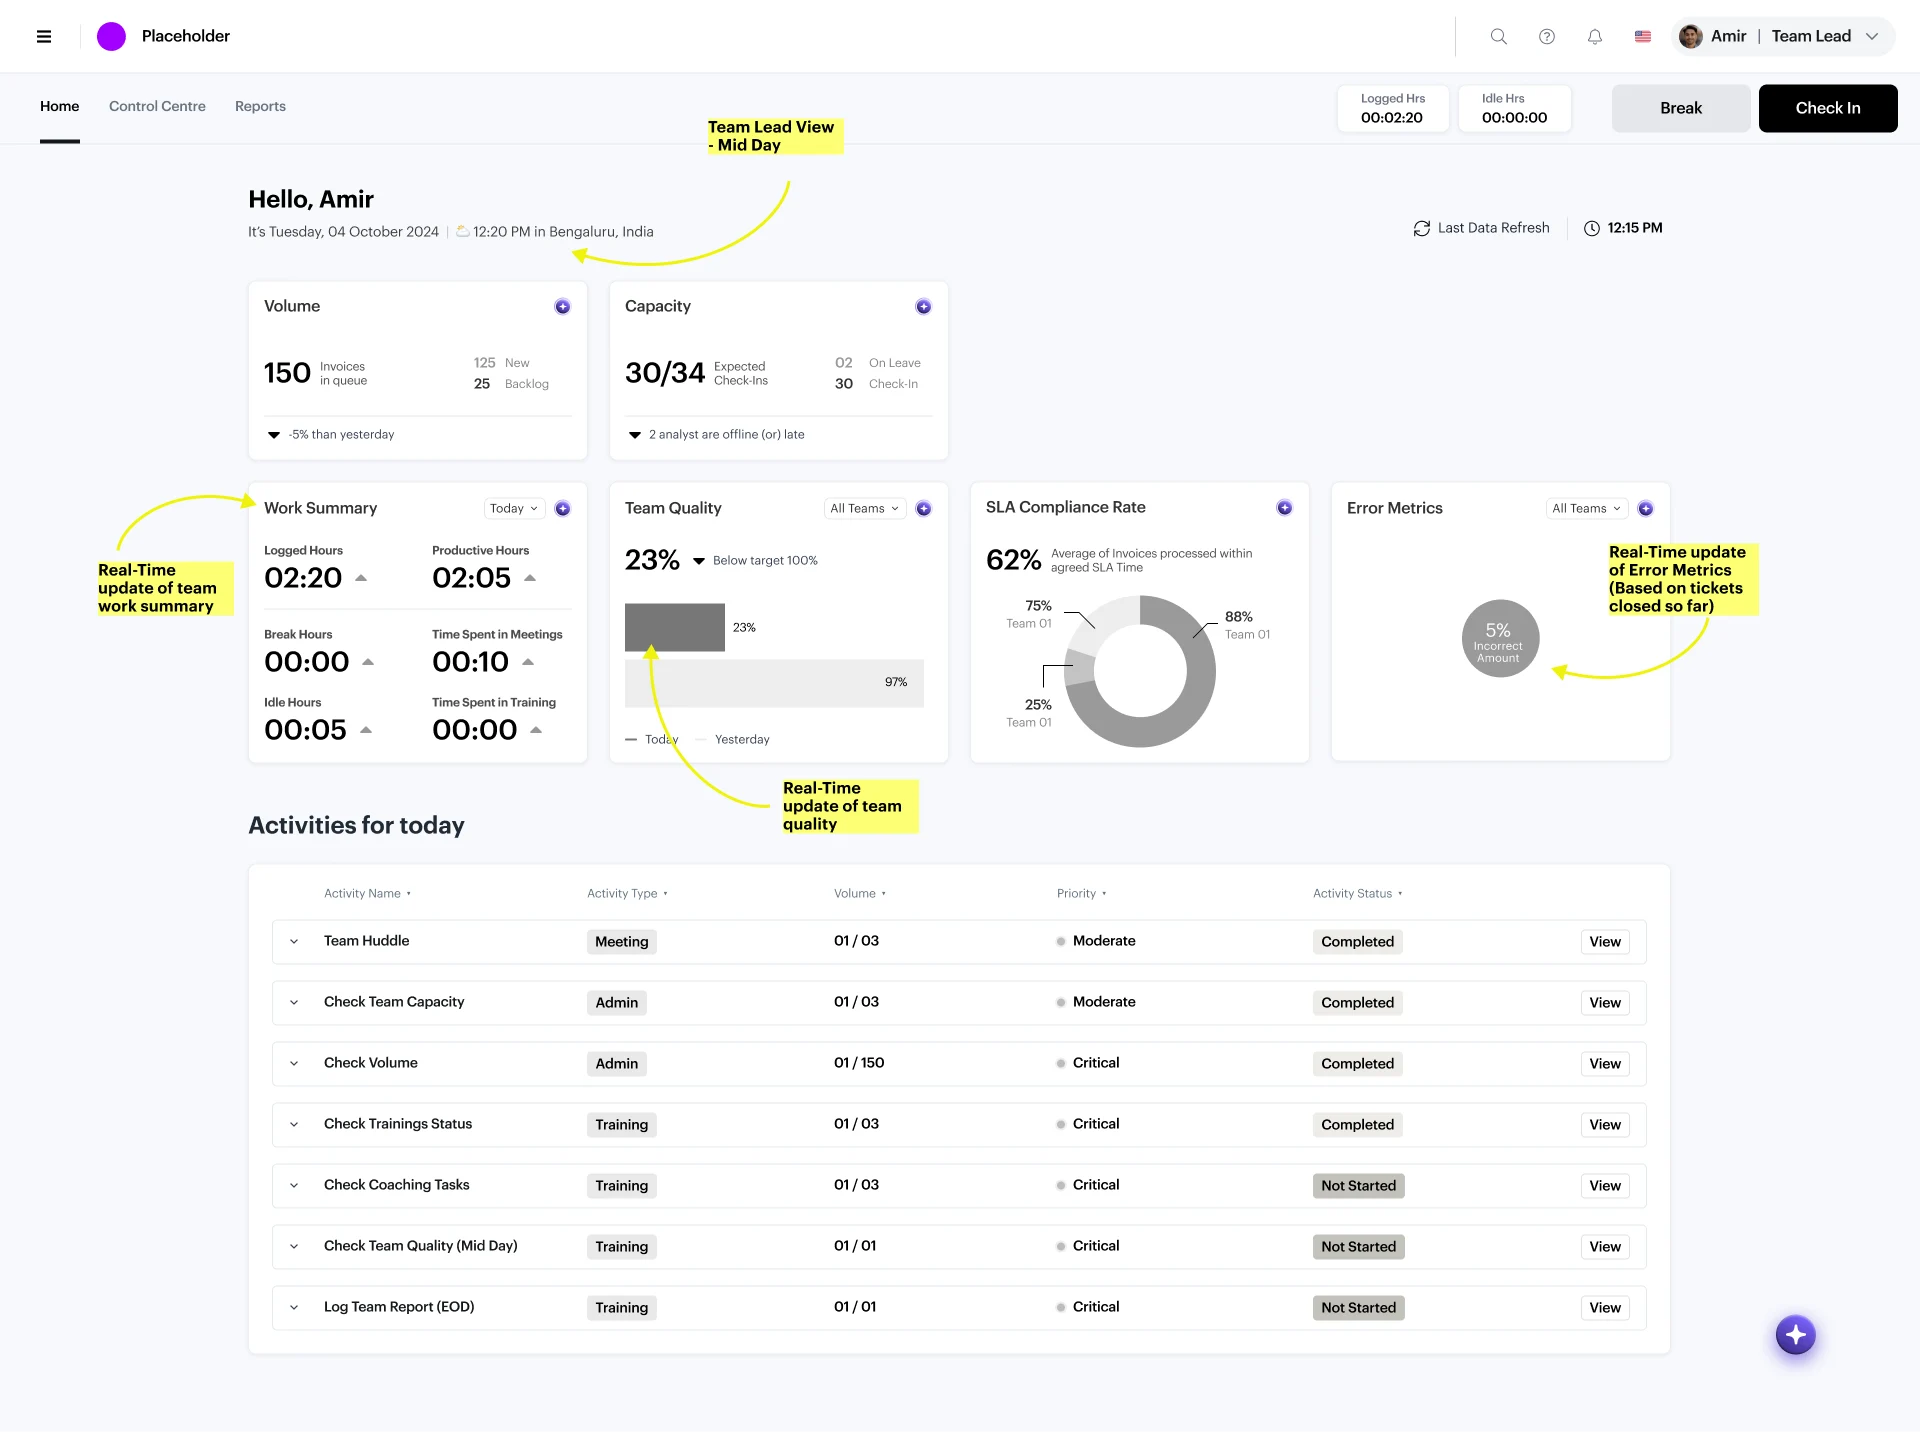
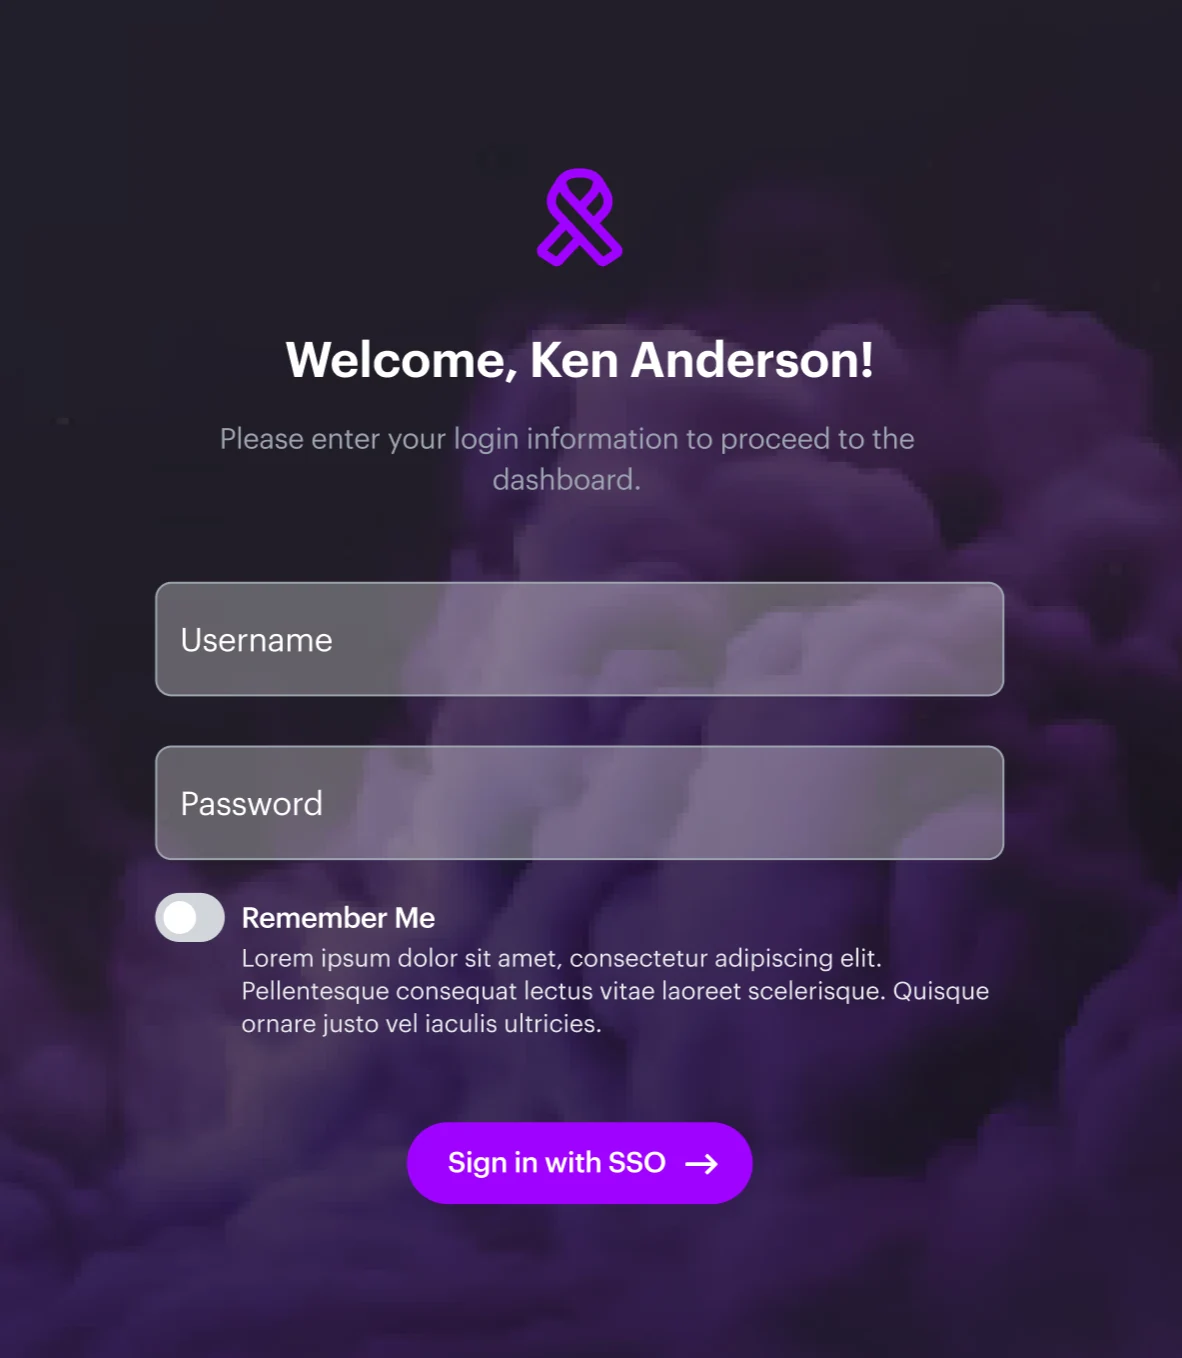
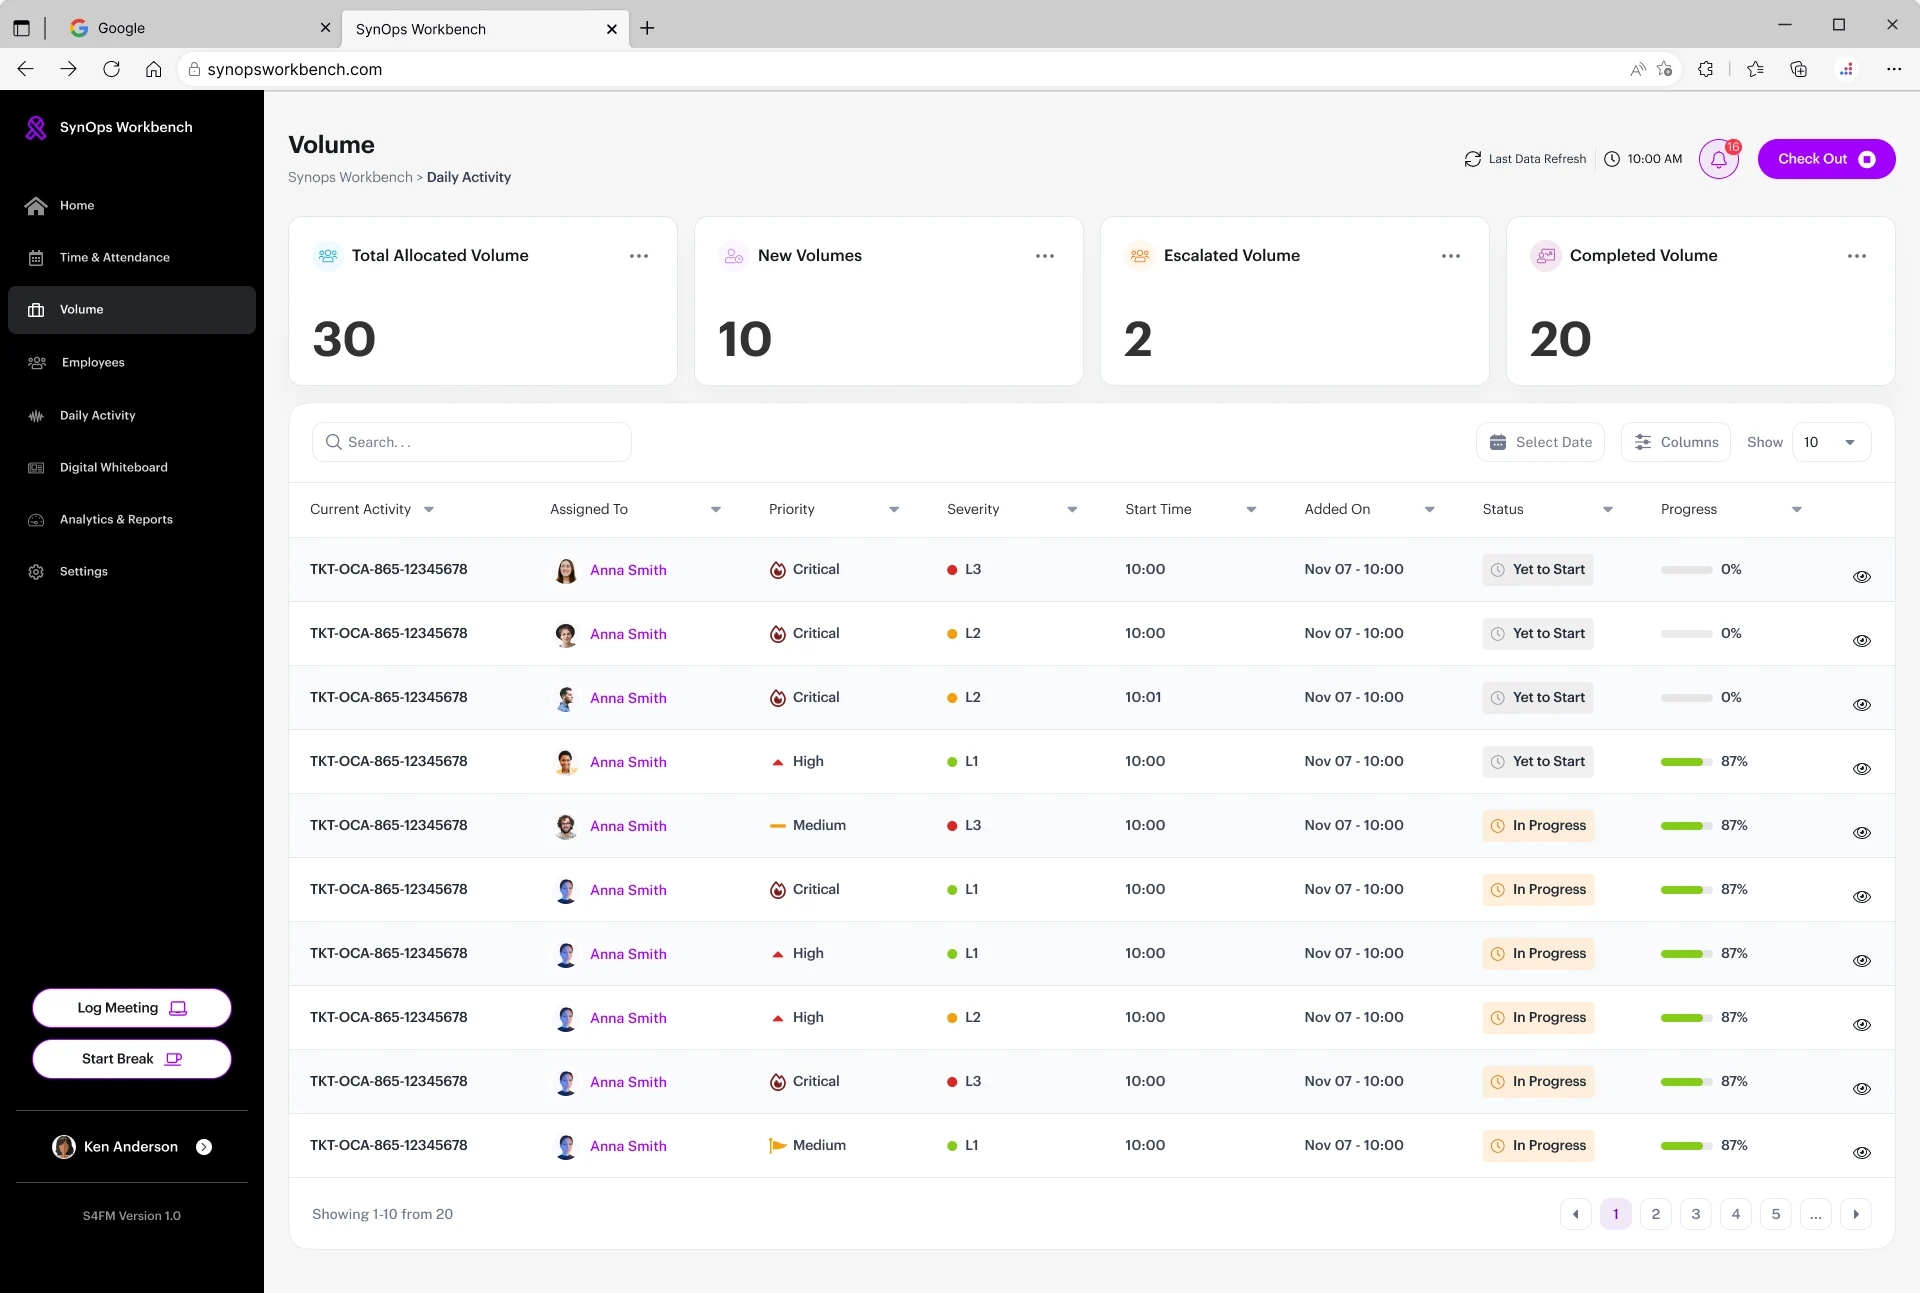
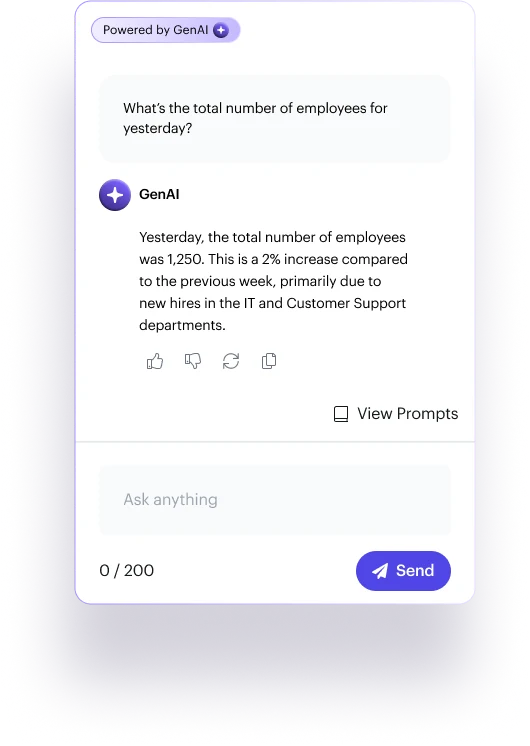
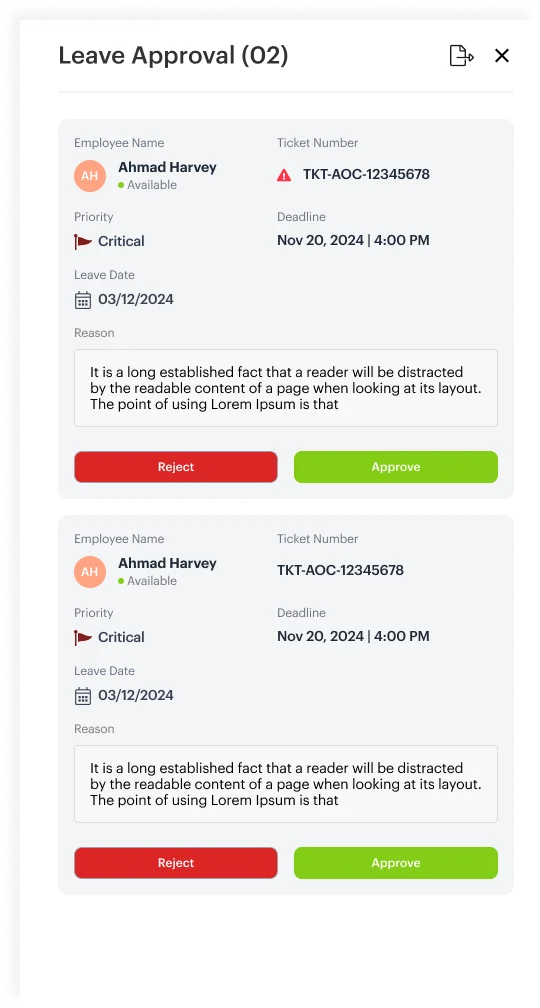
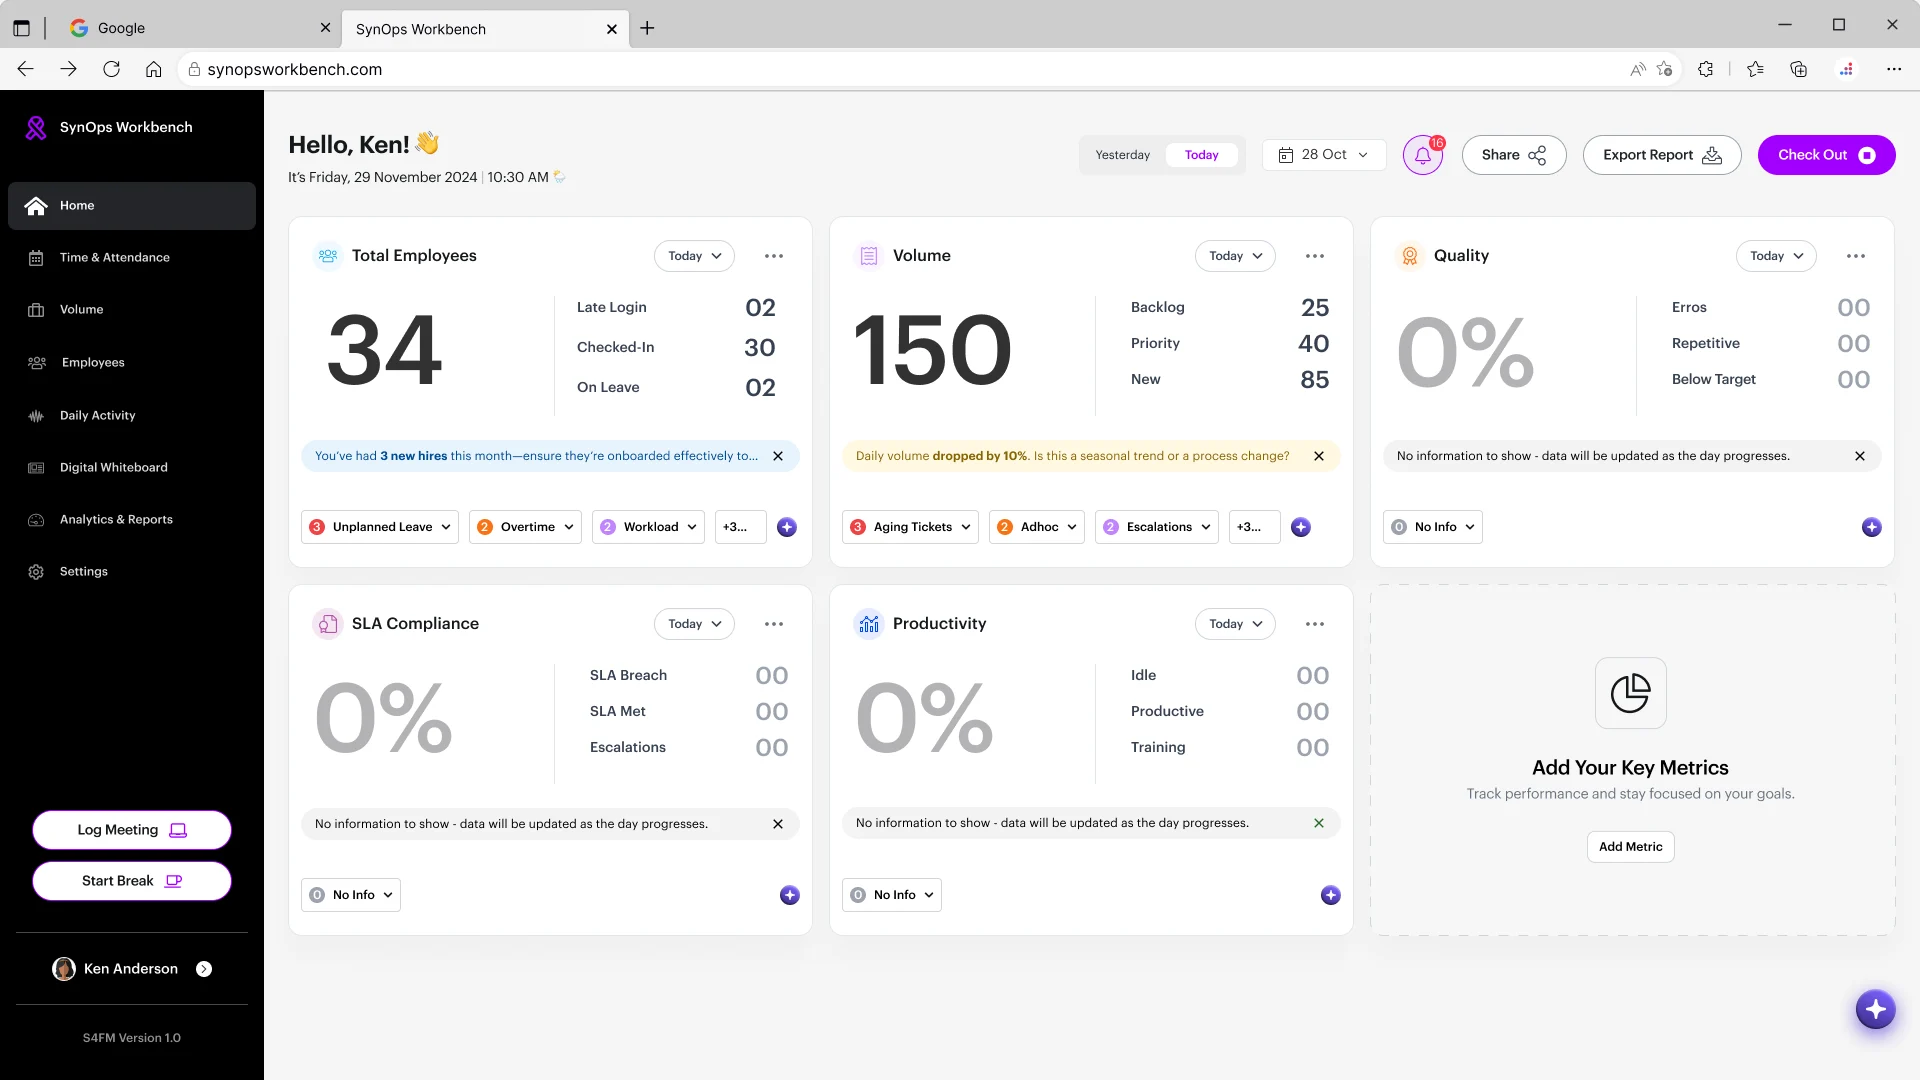
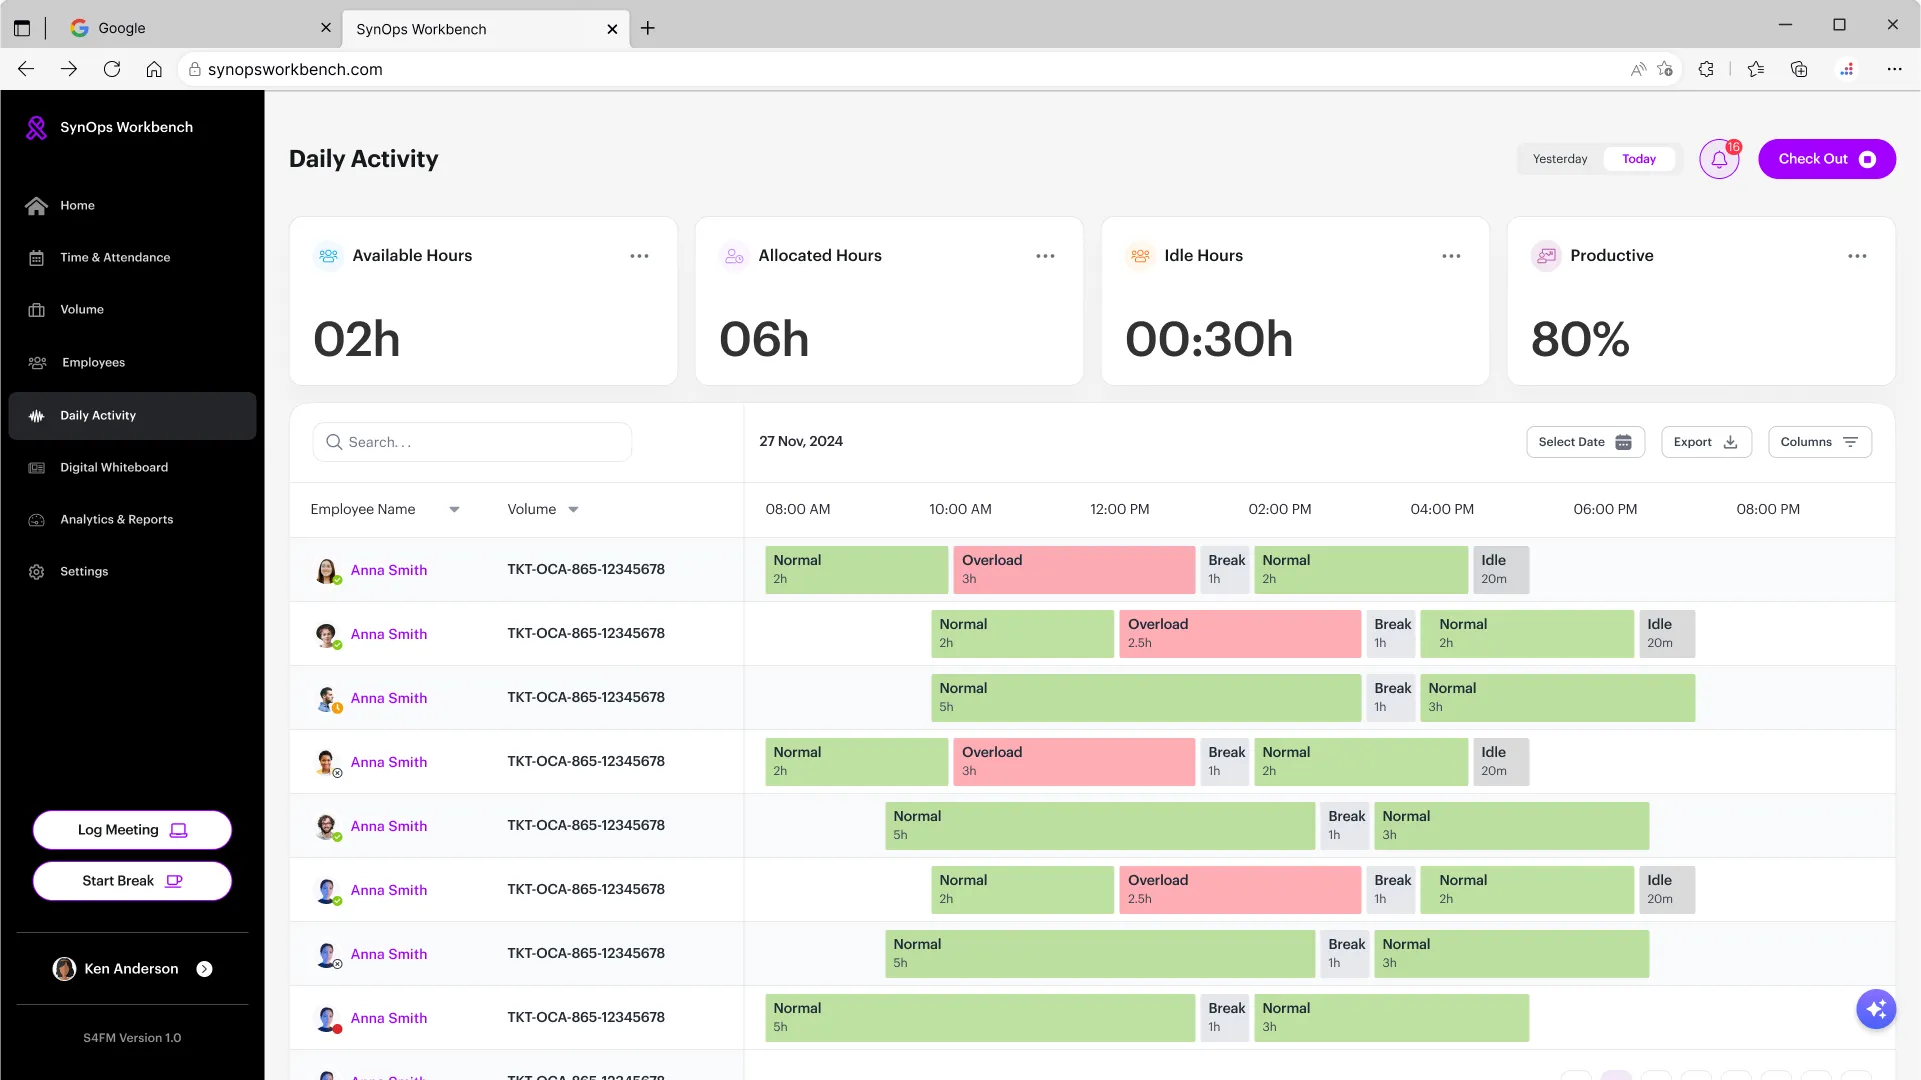
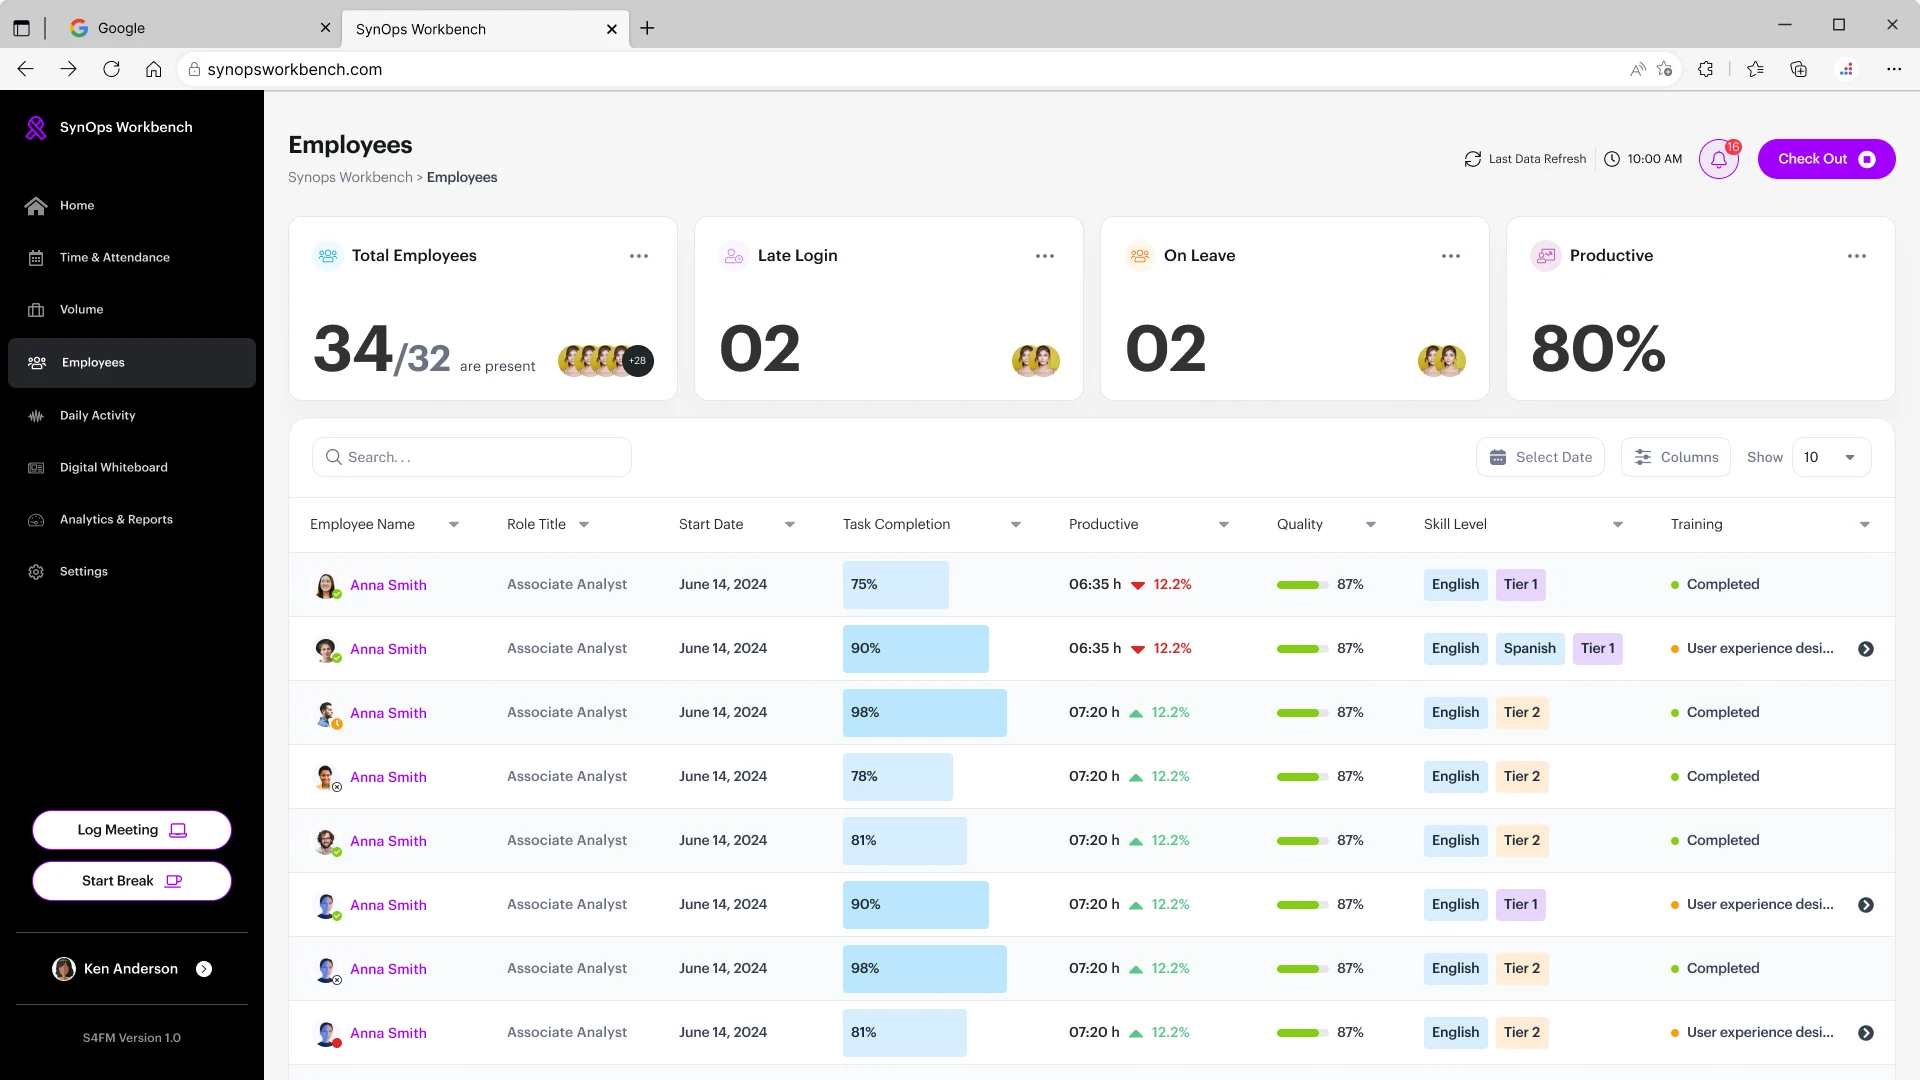
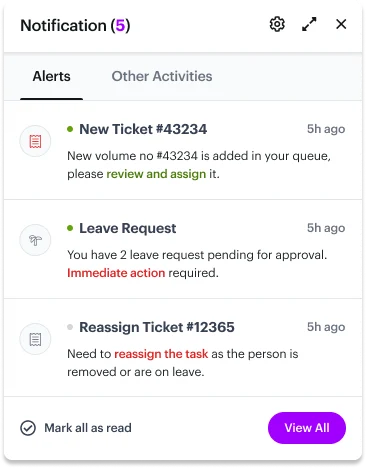
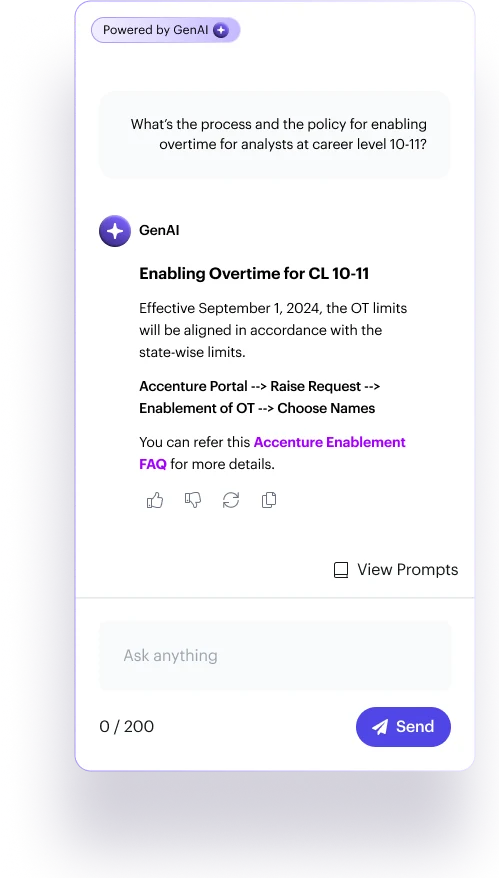
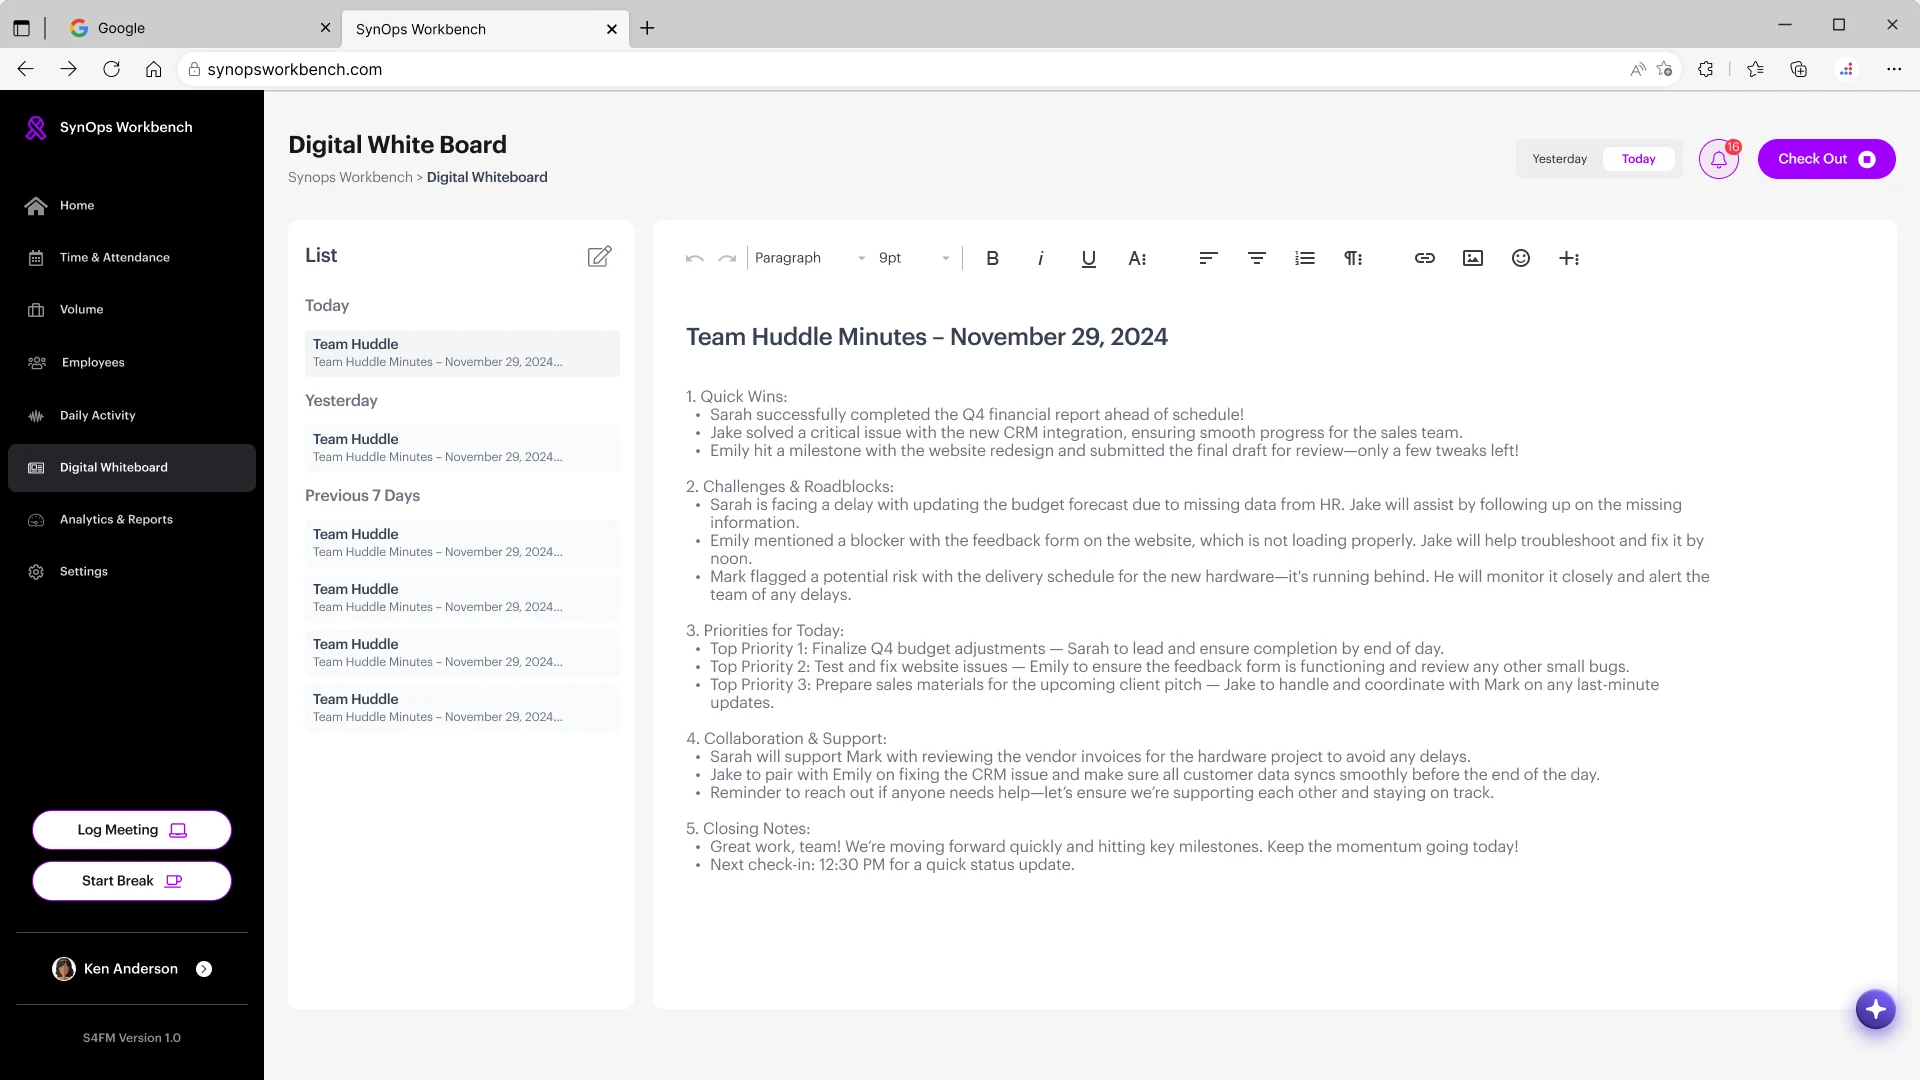
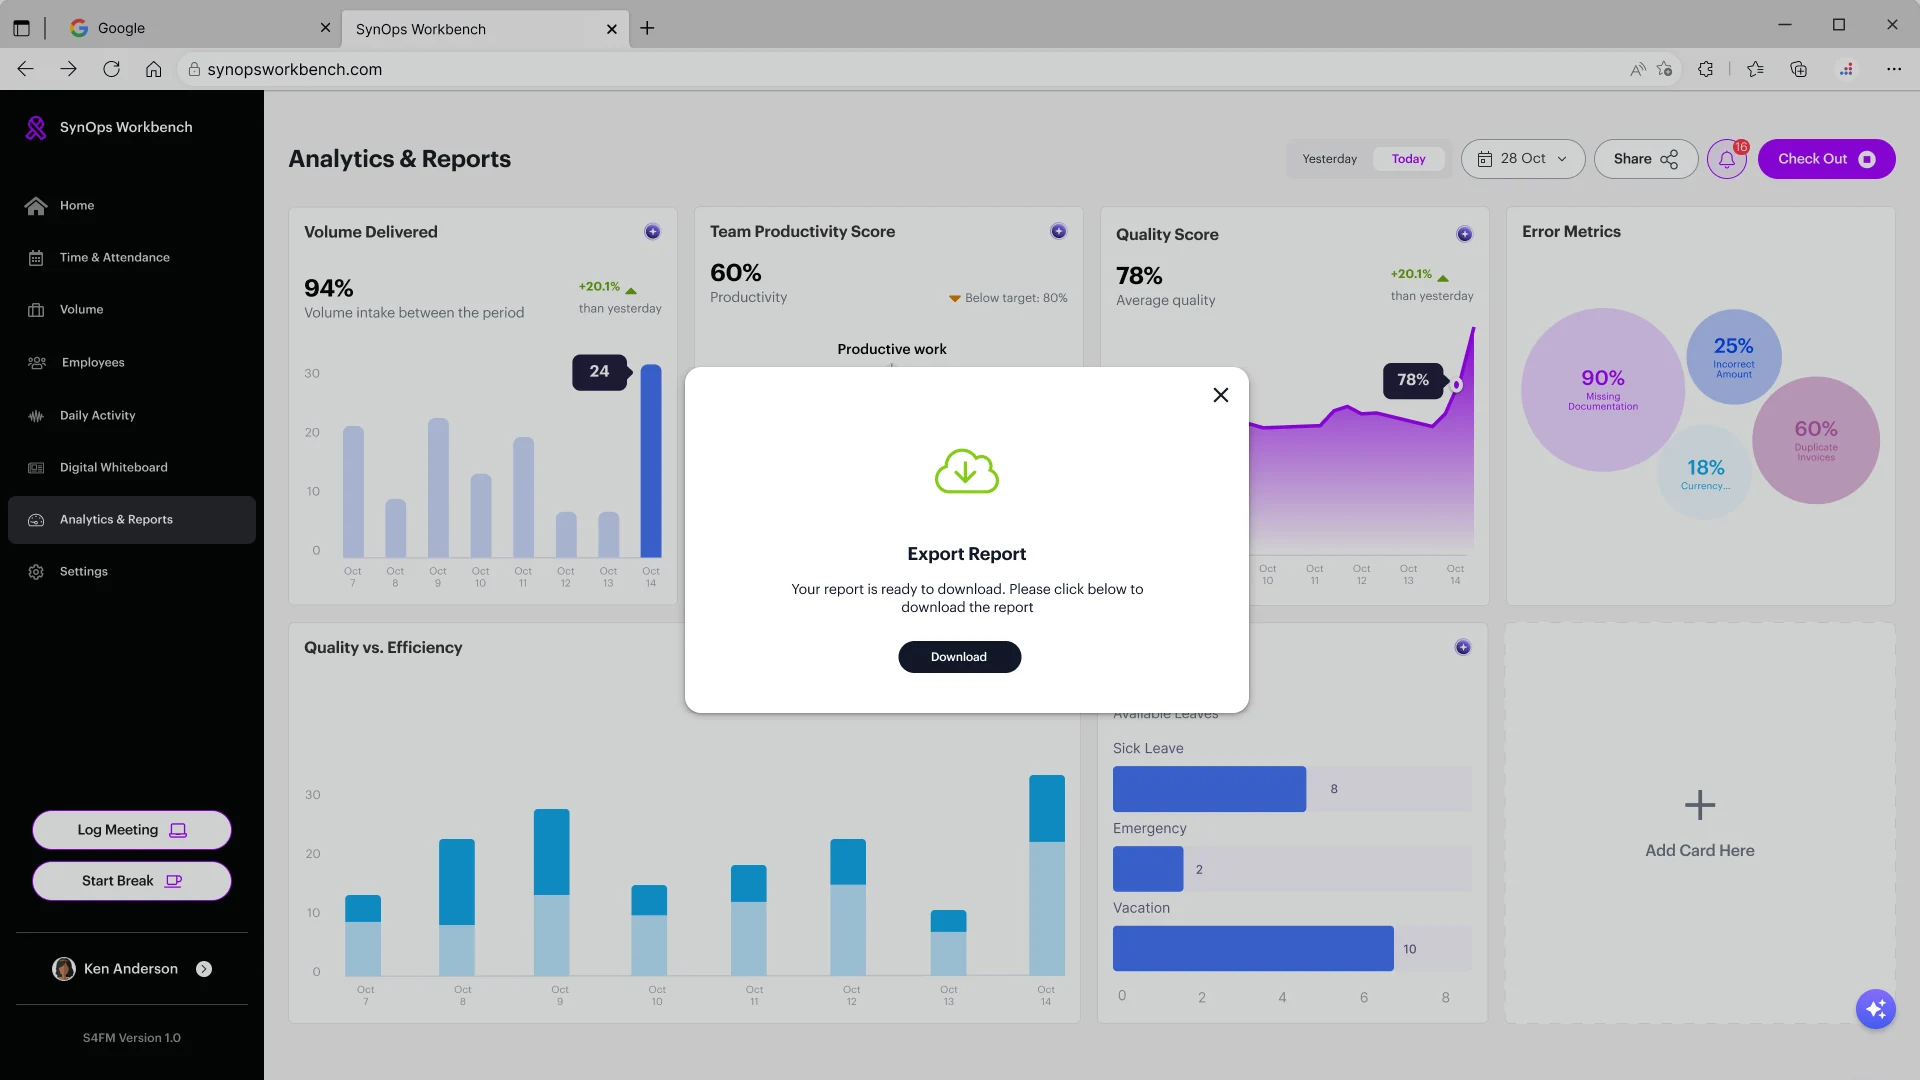
After multiple rounds of feedback and iterative refinement, we developed the final high-fidelity prototype. This version incorporated all required features, including GenAI, and delivered a polished, user-centric interface with a clean and intuitive look and feel.
OUTCOME BY NUMBERS

Key Takeaways
1. Research must be flexible, not rigid
I learned that while having a structured research plan is essential, being flexible and responsive to feedback or shifting priorities is equally important.
2. The value of storytelling in presenting research
Presenting insights in a clear and engaging way helped us align stakeholders and build trust in our recommendations. I improved my ability to structure and communicate research findings effectively.
3. Synthesizing research is just as critical as collecting it
Summarizing user interviews into clear themes and insights helped the broader team understand what mattered most, even if they weren’t part of the sessions.
4. Collaboration with designers improves research impact
Working closely with the UI designer throughout the process ensured research insights were applied meaningfully and quickly during the design phase.